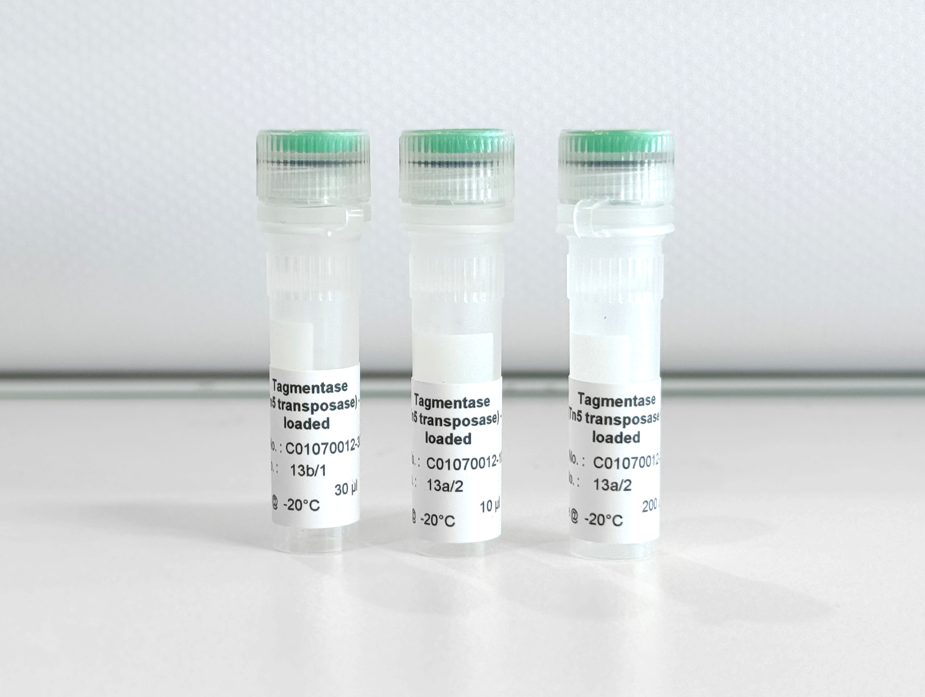
How to properly cite our product/service in your work We strongly recommend using this: pA-Tn5 Transposase - loaded (Hologic Diagenode Cat# C01070001). Click here to copy to clipboard. Using our products or services in your publication? Let us know! |
MeCP2 gene dosage-dependent neurodevelopmentally restricted defects arise by aberrant activation of cell fate-determining bivalent genes
Luoni, Mirko et al.
The overexpression of MECP2 leads to severe neurological deficits in MECP2 duplication syndrome, and its dosage is considered a risk factor in gene therapy for Rett syndrome. However, in MECP2 duplication syndrome patients, MECP2 dysregulation arises at the embryonic stage while in Rett syndrome gene therapy, ME... |
Comparison with Ezh2 reveals the PRC2-dependent functions of Jarid2 in hematopoietic stem Cell lineage commitment
Bjeije, Hassan et al.
Abstract
Previous studies showed the polycomb repressive complex 2 (PRC2) co-factor Jarid2 represses self-renewal transcriptional networks in mouse multipotent progenitor cells (MPPs). But only a fraction of de-repressed HSC-specific genes were associated with loss of H3K27me3, implying Jarid2 may have non-canoni... |
The brain neurovascular epigenome and its association with dementia
Ziegler, Kevin Chris et al.
Cerebral small vessel disease (SVD) is frequently comorbid with Alzheimer's disease (AD), and brain endothelial cells (BECs) express genes associated with AD genetic risk. However, the epigenome of neurovascular cells and its intersection with genetic risk remain unexplored. Here, we generated gene regulomes for h... |
DNA methylation at retrotransposons protects the germline by preventing NRF1-mediated activation
Leismann, Jessica et al.
Silencing evolutionary young retrotransposons by cytosine DNA methylation is essential for spermatogenesis, as failure to methylate their promoters leads to reactivation, meiotic failure, and infertility. How retrotransposons reactivate in the absence of DNA methylation is poorly understood. We show that upon defe... |
Epigenomic disorder and partial EMT impair luminal progenitor integrity in Brca1-associated breast tumorigenesis
Landragin, Camille et al.
In breast cancer related to the BRCA1 mutation, luminal progenitor cells are believed to be the cells of origin, yet how these cells transform into invasive cancer cells remain poorly understood. Here, we combine single-cell epigenomic and transcriptomic data to reconstitute sequences of events in luminal cells that... |
The establishment of nuclear organization in mouse embryos is orchestrated by multiple epigenetic pathways
Pal, Mrinmoy et al.
The folding of the genome in the 3D nuclear space is fundamental for regulating all DNA-related processes. The association of the genome with the nuclear lamina into lamina-associated domains (LADs) represents the earliest feature of nuclear organization during development. Here, we performed a gain-of-function sc... |
Accelerated epigenetic aging in Huntington’s disease involves polycomb repressive complex 1
Baptiste Brulé et al.
Loss of epigenetic information during physiological aging compromises cellular identity, leading to de-repression of developmental genes. Here, we assessed the epigenomic landscape of vulnerable neurons in two reference mouse models of Huntington neurodegenerative disease (HD), using cell-type-specific multi-omics, ... |
HDAC1 and HDAC2 are bidirectional enzymes that catalyze histone sorbylation to induce epigenetic alterations
Akihiro Ito et al.
Reversible histone acylation is crucial for epigenetic gene expression regulation. Histone acylation is typically mediated by lysine acyltransferases (KATs), which use acyl-CoAs as acyl donors. Here, we revealed the novel role of the histone deacetylases HDAC1 and HDAC2 in histone acylation catalysis. Notably, we sh... |
Chromatin environment-dependent effects of DOT1L on gene expression in male germ cells
Manon Coulée et al.
The H3K79 methyltransferase DOT1L is essential for multiple aspects of mammalian development where it has been shown to regulate gene expression. Here, by producing and integrating epigenomic and spike-in RNA-seq data, we decipher the molecular role of DOT1L during mouse spermatogenesis and show that it has opposite... |
The molecular consequences of FOXF1 missense mutations associated with alveolar capillary dysplasia with misalignment of pulmonary veins
G. G. Edel et al.
Background
Alveolar capillary dysplasia with misalignment of pulmonary veins (ACD/MPV) is a fatal congenital lung disorder strongly associated with genomic alterations in the Forkhead box F1 (FOXF1) gene and its regulatory region. However, little is known about how FOXF1 genomic alterations cause ACD/MPV and what m... |
Histone variant H2BE controls activity-dependent gene expression and homeostatic scaling
Emily R. Feierman et al.
A cell’s ability to respond and adapt to environmental stimuli relies in part on transcriptional programs controlled by histone proteins. Histones affect transcription through numerous mechanisms including through replacement with variant forms that carry out specific functions. We recently identified the firs... |
A PI3Kδ-Foxo1-FasL signaling amplification loop rewires CD4+ T helper cell signaling, differentiation and epigenetic remodeling
Dominic P Golec et al.
While inputs regulating CD4+ T helper cell (Th) differentiation are well-defined, the integration of downstream signaling with transcriptional and epigenetic programs that define Th-lineage identity remain unresolved. PI3K signaling is a critical regulator of T cell function; activating mutations affecting PI3K... |
Inflammation impacts androgen receptor signaling in basal prostate stem cells through interleukin 1 receptor antagonist
Paula O. Cooper et al.
Chronic prostate inflammation in patients with benign prostate hyperplasia (BPH) correlates with the severity of symptoms. How inflammation contributes to prostate enlargement and/or BPH symptoms and the underlying mechanisms remain unclear. In this study, we utilize a unique transgenic mouse model that mimics chron... |
Epigenome profiling identifies H3K27me3 regulation of extra-cellular matrix composition in human corticogenesis
Nora Ditzer et al.
Epigenetic mechanisms regulate gene expression programs during neurogenesis, but the extent of epigenetic remodelling during human cortical development remains unknown. Here, we characterize the epigenetic landscape of the human developing neocortex by leveraging Epi-CyTOF, a mass cytometry-based approach for the si... |
Two-factor authentication underpins the precision of the piRNA pathway
Dias Mirandela M. et al.
The PIWI-interacting RNA (piRNA) pathway guides the DNA methylation of young, active transposons during germline development in male mice. piRNAs tether the PIWI protein MIWI2 (PIWIL4) to the nascent transposon transcript, resulting in DNA methylation through SPOCD1. Transposon methylation requires great precision: ... |
NanoTag - an IgG-free method for mapping DNA-protein interactions
Maria A. Dimitriu et al.
Genome-wide profiling of DNA-protein interactions in cells can provide important information about mechanisms of gene regulation. Most current methods for genome-wide profiling of DNA-bound proteins, such as ChIP-seq and CUT&Tag, use conventional IgG antibodies to bind target protein(s), which limits their appli... |
Transcription factor EGR2 controls homing and pathogenicity of T17cells in the central nervous system.
Gao Y. et al.
CD4 T helper 17 (T17) cells protect barrier tissues but also trigger autoimmunity. The mechanisms behind these opposing processes remain unclear. Here, we found that the transcription factor EGR2 controlled the transcriptional program of pathogenic T17 cells in the central nervous system (CNS) but not that of protec... |
The Hdc GC box is critical for Hdc gene transcription andhistamine-mediated anaphylaxis.
Li Y. et al.
BACKGROUND: Histamine is a critical mediator of anaphylaxis, a neurotransmitter, and a regulator of gastric acid secretion. Histidine decarboxylase is a rate-limiting enzyme for histamine synthesis. However, in vivo regulation of Hdc, the gene that encodes histidine decarboxylase is poorly understood. OBJECTIVE: We ... |
Retrospective analysis of enhancer activity and transcriptome history.
Boers R. et al.
Cell state changes in development and disease are controlled by gene regulatory networks, the dynamics of which are difficult to track in real time. In this study, we used an inducible DCM-RNA polymerase subunit b fusion protein which labels active genes and enhancers with a bacterial methylation mark that does not ... |
Simultaneous profiling of histone modifications and DNA methylation viananopore sequencing.
Yue X. et al.
The interplay between histone modifications and DNA methylation drives the establishment and maintenance of the cellular epigenomic landscape, but it remains challenging to investigate the complex relationship between these epigenetic marks across the genome. Here we describe a nanopore-sequencing-based-method, nano... |
A SOX2-engineered epigenetic silencer factor represses the glioblastomagenetic program and restrains tumor development.
Benedetti V. et al.
Current therapies remain unsatisfactory in preventing the recurrence of glioblastoma multiforme (GBM), which leads to poor patient survival. By rational engineering of the transcription factor SOX2, a key promoter of GBM malignancy, together with the Kruppel-associated box and DNA methyltransferase3A/L catalytic dom... |
Caffeine intake exerts dual genome-wide effects on hippocampal metabolismand learning-dependent transcription.
Paiva I. et al.
Caffeine is the most widely consumed psychoactive substance in the world. Strikingly, the molecular pathways engaged by its regular consumption remain unclear. We herein addressed the mechanisms associated with habitual (chronic) caffeine consumption in the mouse hippocampus using untargeted orthogonal omics techniq... |
ATRX regulates glial identity and the tumor microenvironment inIDH-mutant glioma
Babikir, Husam and Wang, Lin and Shamardani, Karin andCatalan, Francisca and Sudhir, Sweta and Aghi, Manish K. andRaleigh, David R. and Phillips, Joanna J. and Diaz, AaronA.
Background Recent single-cell transcriptomic studies report that IDH-mutant gliomas share a common hierarchy of cellular phenotypes, independent of genetic subtype. However, the genetic differences between IDH-mutant glioma subtypes are prognostic, predictive of response to chemotherapy, and correlate with distinct ... |
Autocrine Vitamin D-signaling switches off pro-inflammatory programsof Th1 cells
Chauss D.et al.
The molecular mechanisms governing orderly shutdown and retraction of CD4+ T helper (Th)1 responses remain poorly understood. Here, we show that complement triggers contraction of Th1 responses by inducing intrinsic expression of the vitamin D (VitD) receptor (VDR) and the VitD-activating enzyme CYP27B1, permitting ... |