Universal CUT&Tag Kit Enables Robust Profiling of Diverse Non‑Histone Targets Across Cell Types
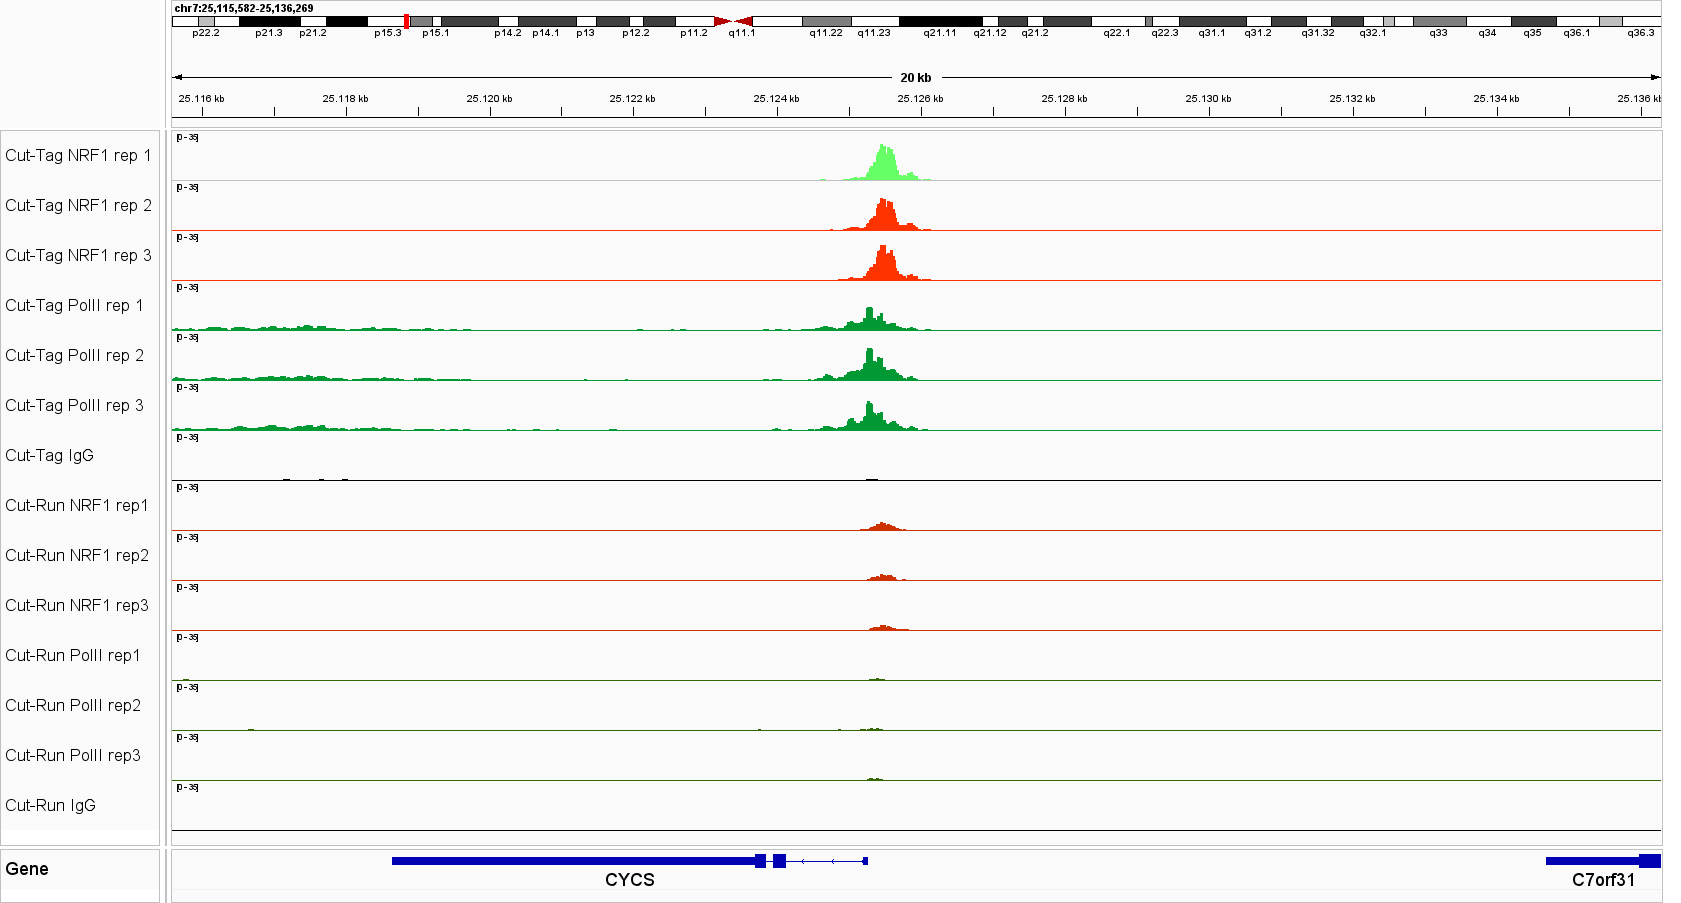
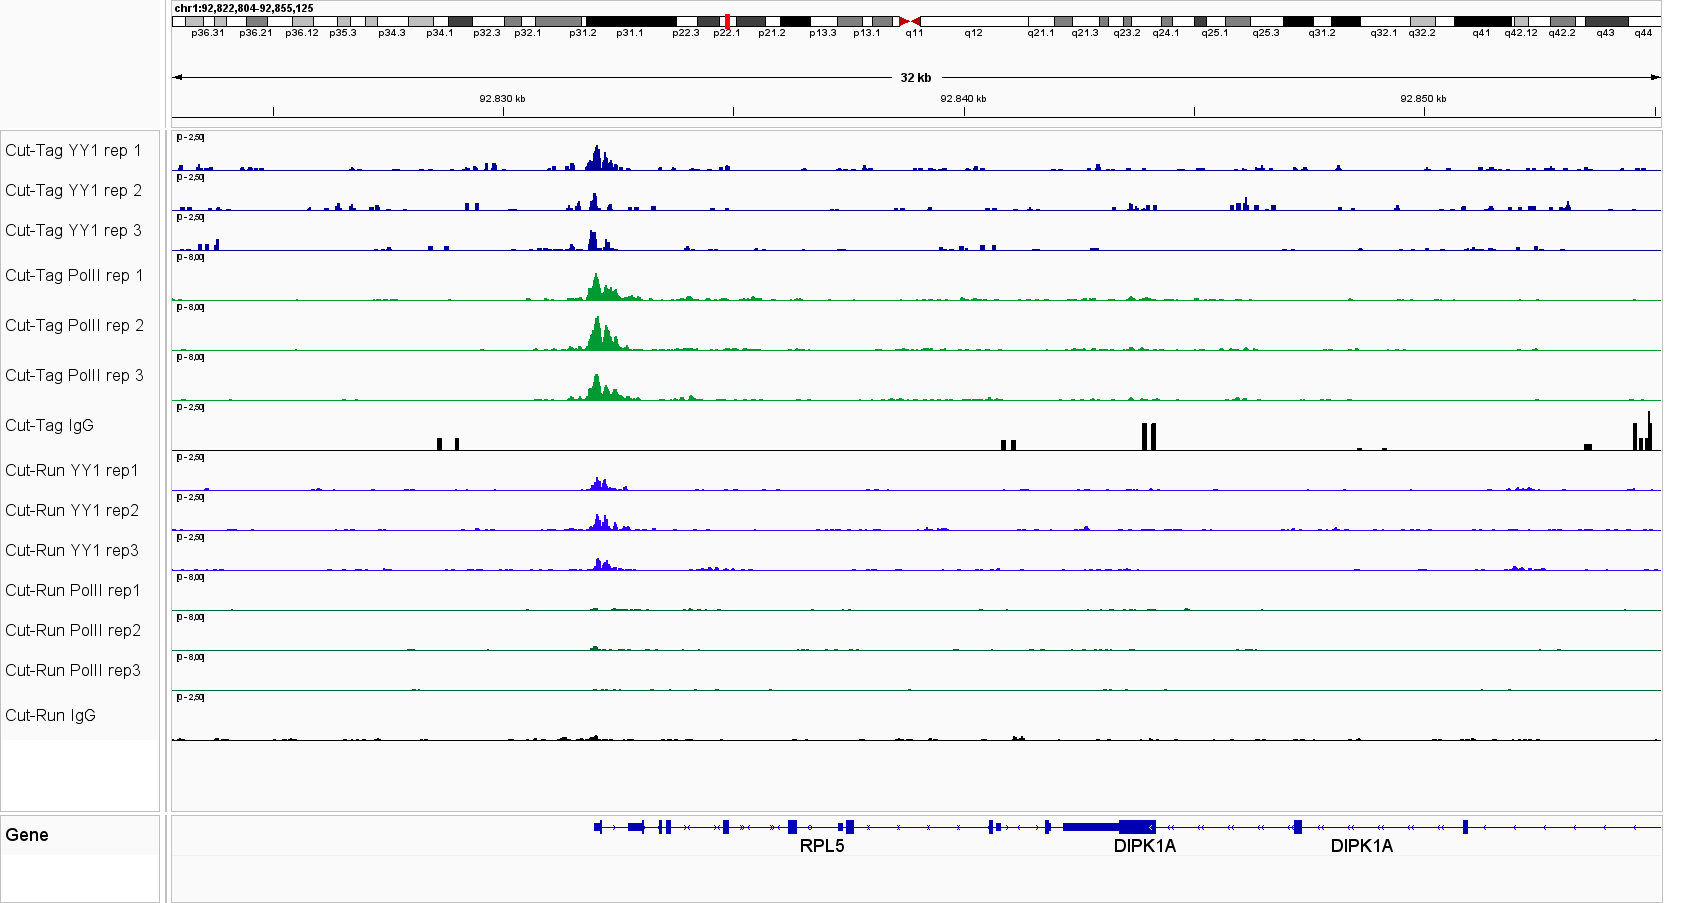
Universal CUT&Tag profiles reveal strong and specific enrichment of transcription factors at known target loci across diverse cell lines and targets. Figure 1. IGV tracks for CTCF, Pol II, STAT3, STAT5A, NRF1 and YY1 in leukemia cells lines and K562 cells, demonstrating consistent signal and low background.
A.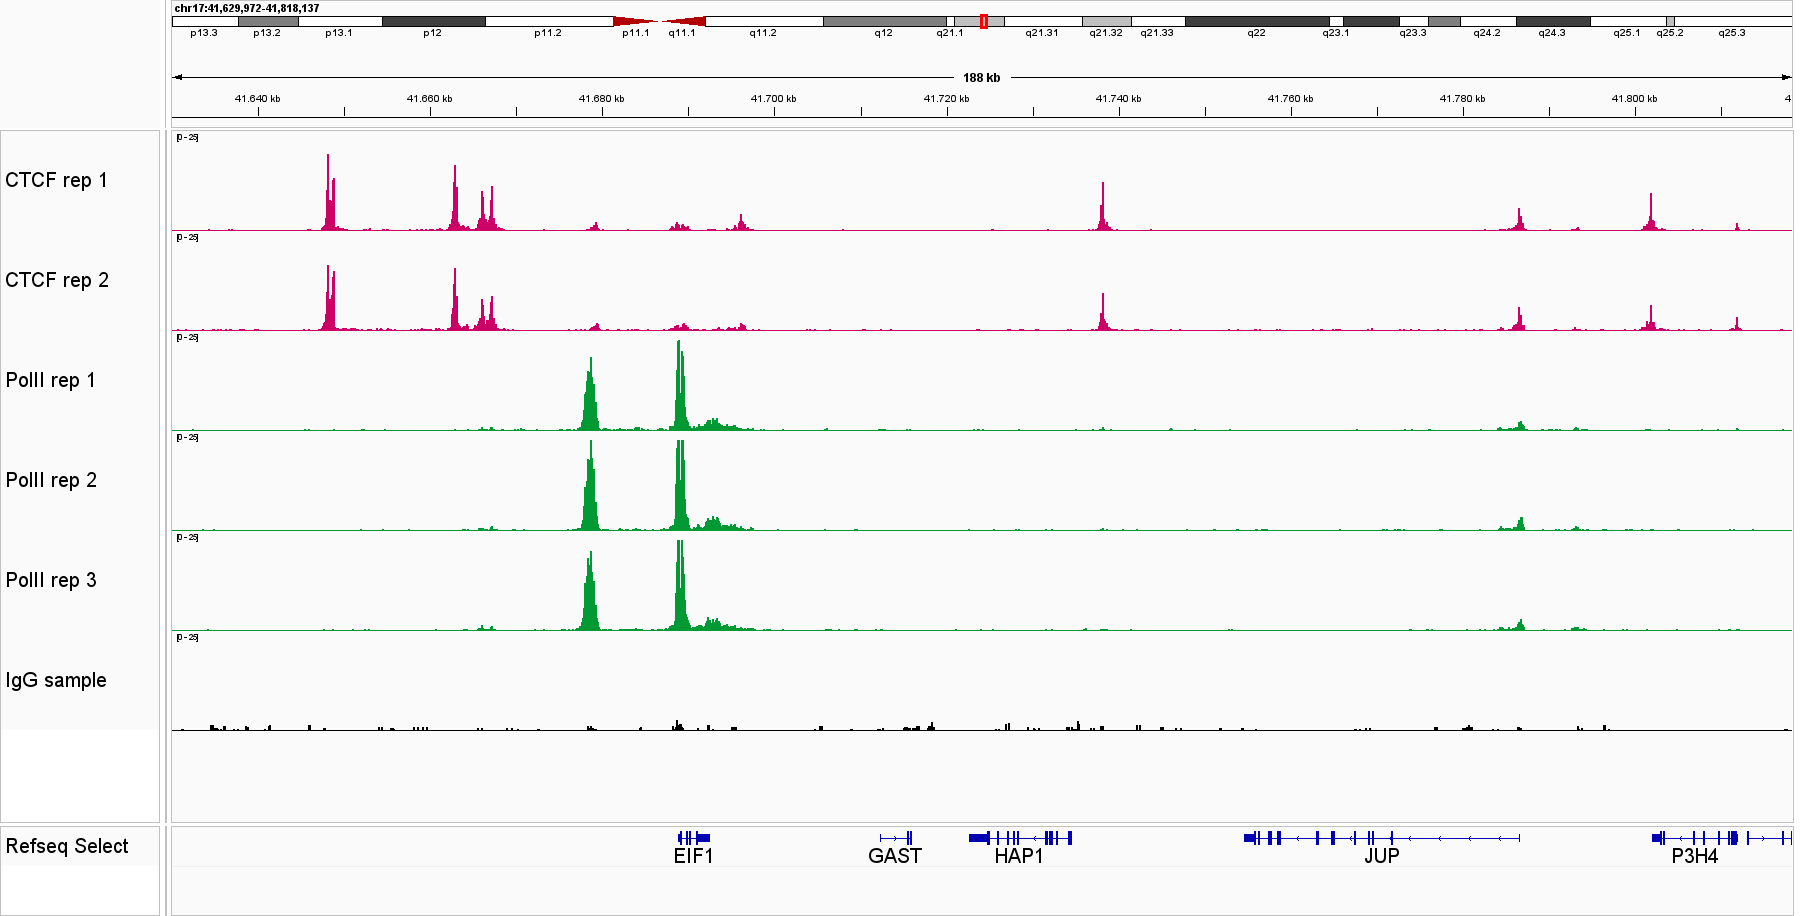
B.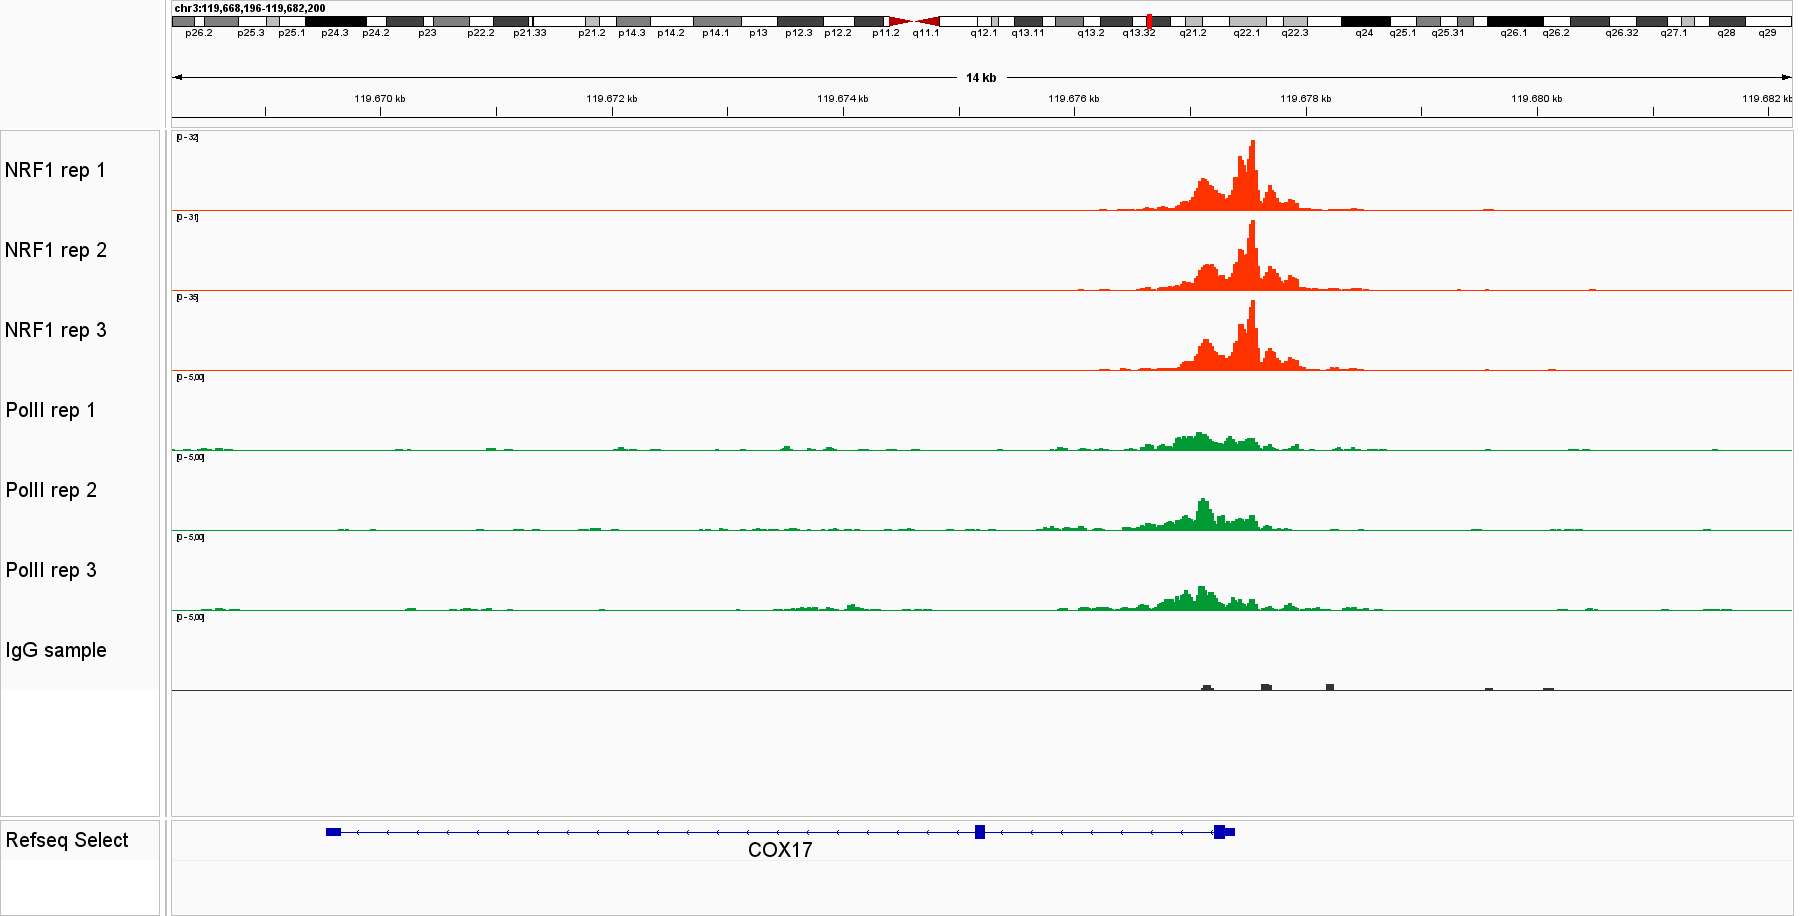
C.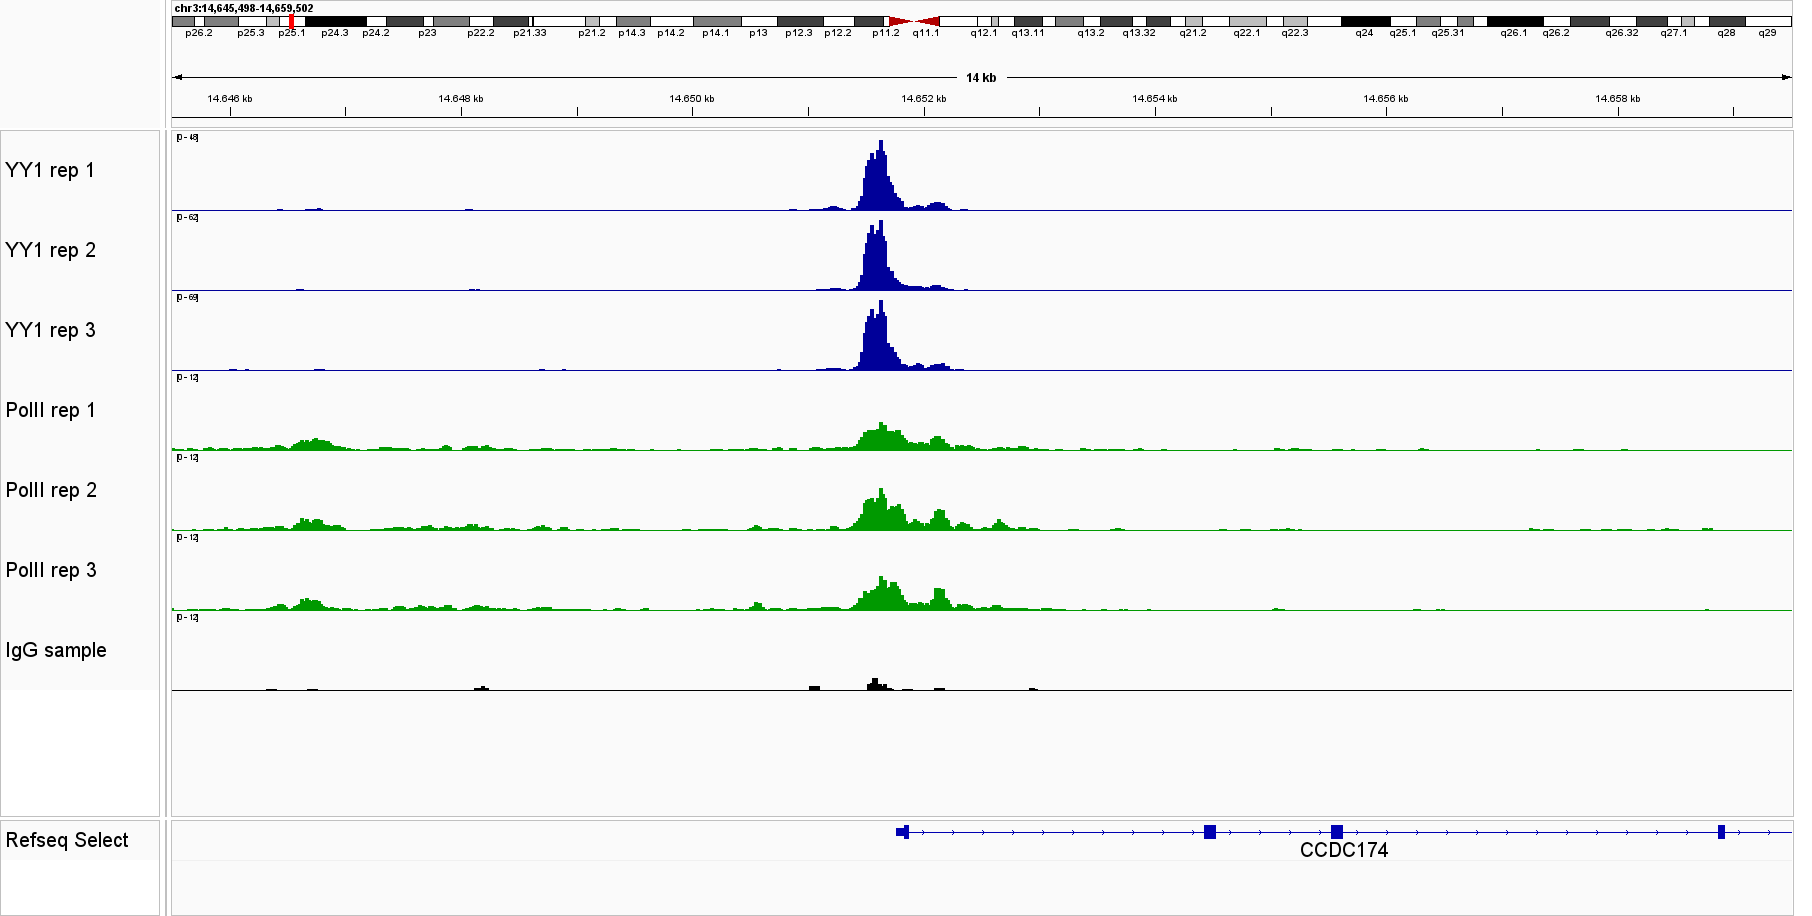
D.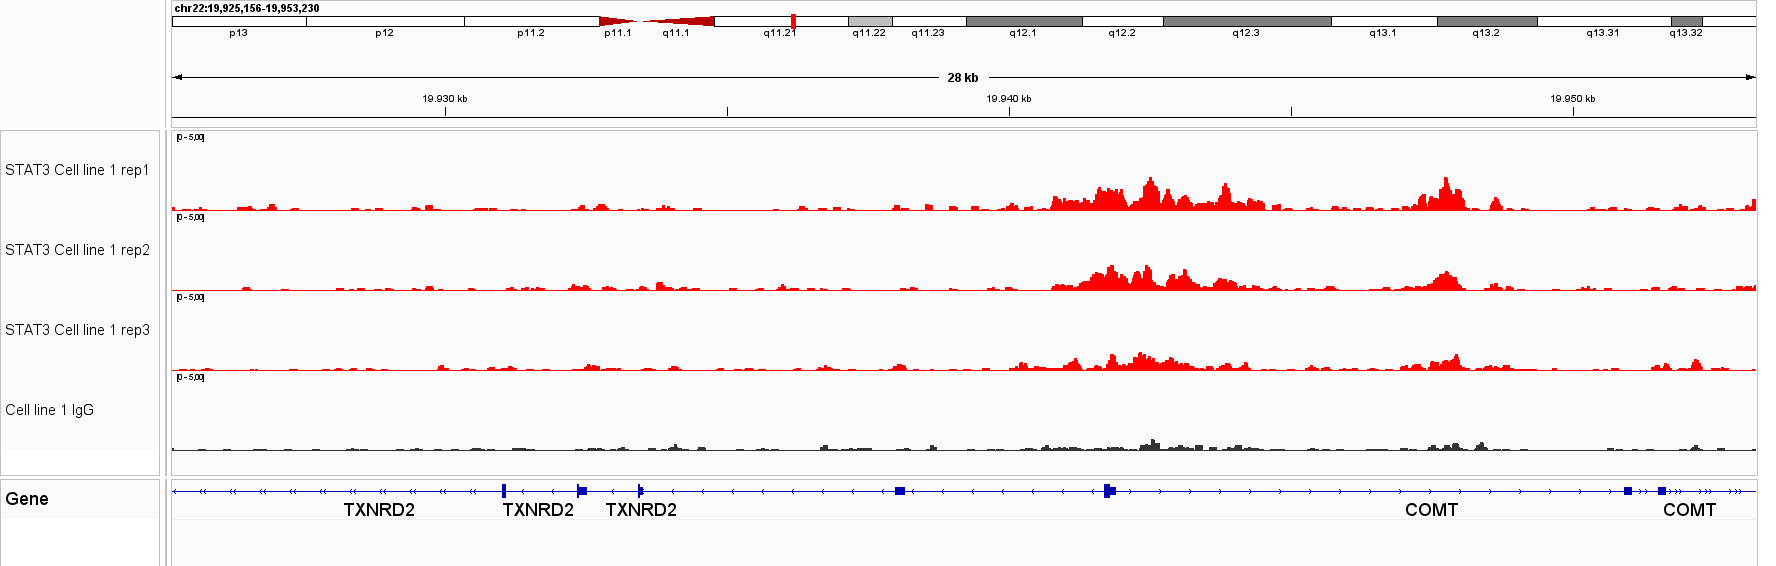
E.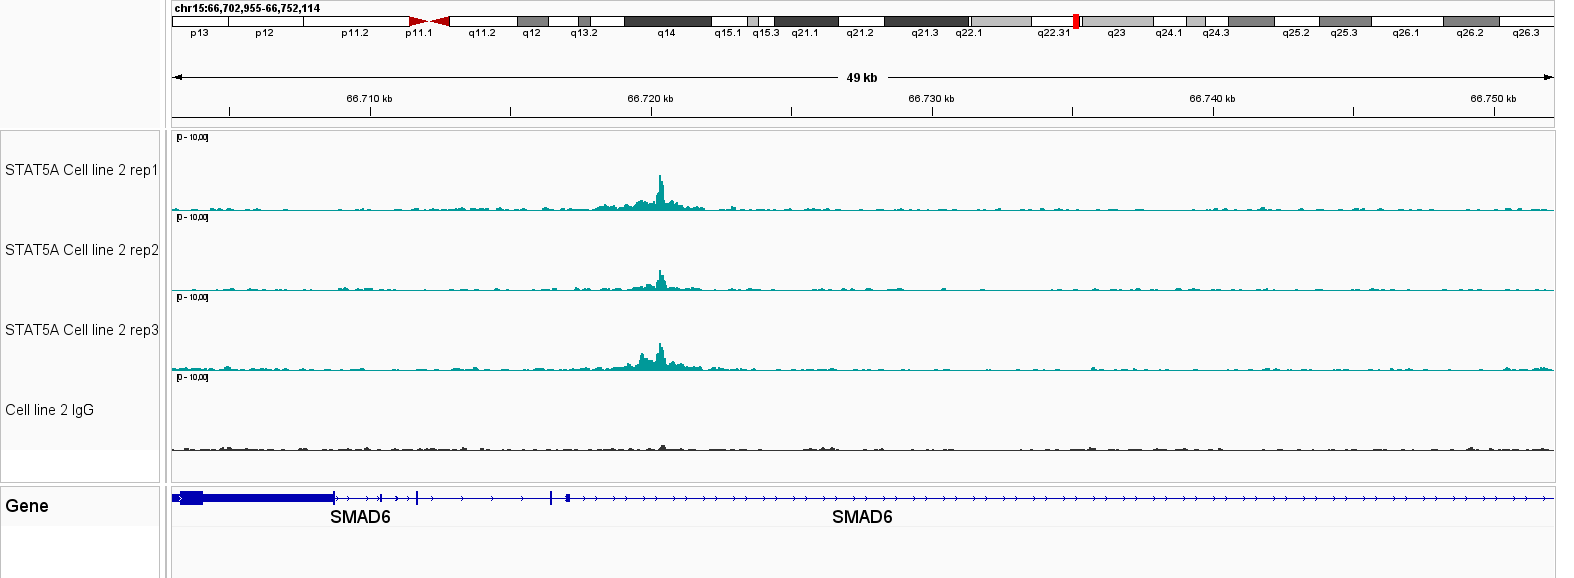
Figure 1. IGV genome browser views of CUT&Tag profiles generated with the Universal CUT&Tag Kit from 300,000 cells per sample. Shown are six non‑histone targets—STAT3 and STAT5A (leukemia cell lines, in collaboration with Dr. Eleni Katsantoni’s laboratory, BRFAA, Athens, Greece) and CTCF, RNA Polymerase II, NRF1, and YY1 (K562 cells). Genomic loci displayed represent well‑established, target‑specific regions for each antibody. Replicates show highly concordant peaks, confirming assay reproducibility, while IgG controls exhibit low background. All targets display clear, specific enrichment. In K562 cells, NRF1 and YY1 profiles are shown alongside RNA Polymerase II, illustrating co‑localization at expressed genes and supporting the link between transcription factor binding and active transcription.
Universal CUT&Tag Demonstrates Specific Peak Enrichment
SUZ12 and H3K27me3 Signal at HOXA Cluster.
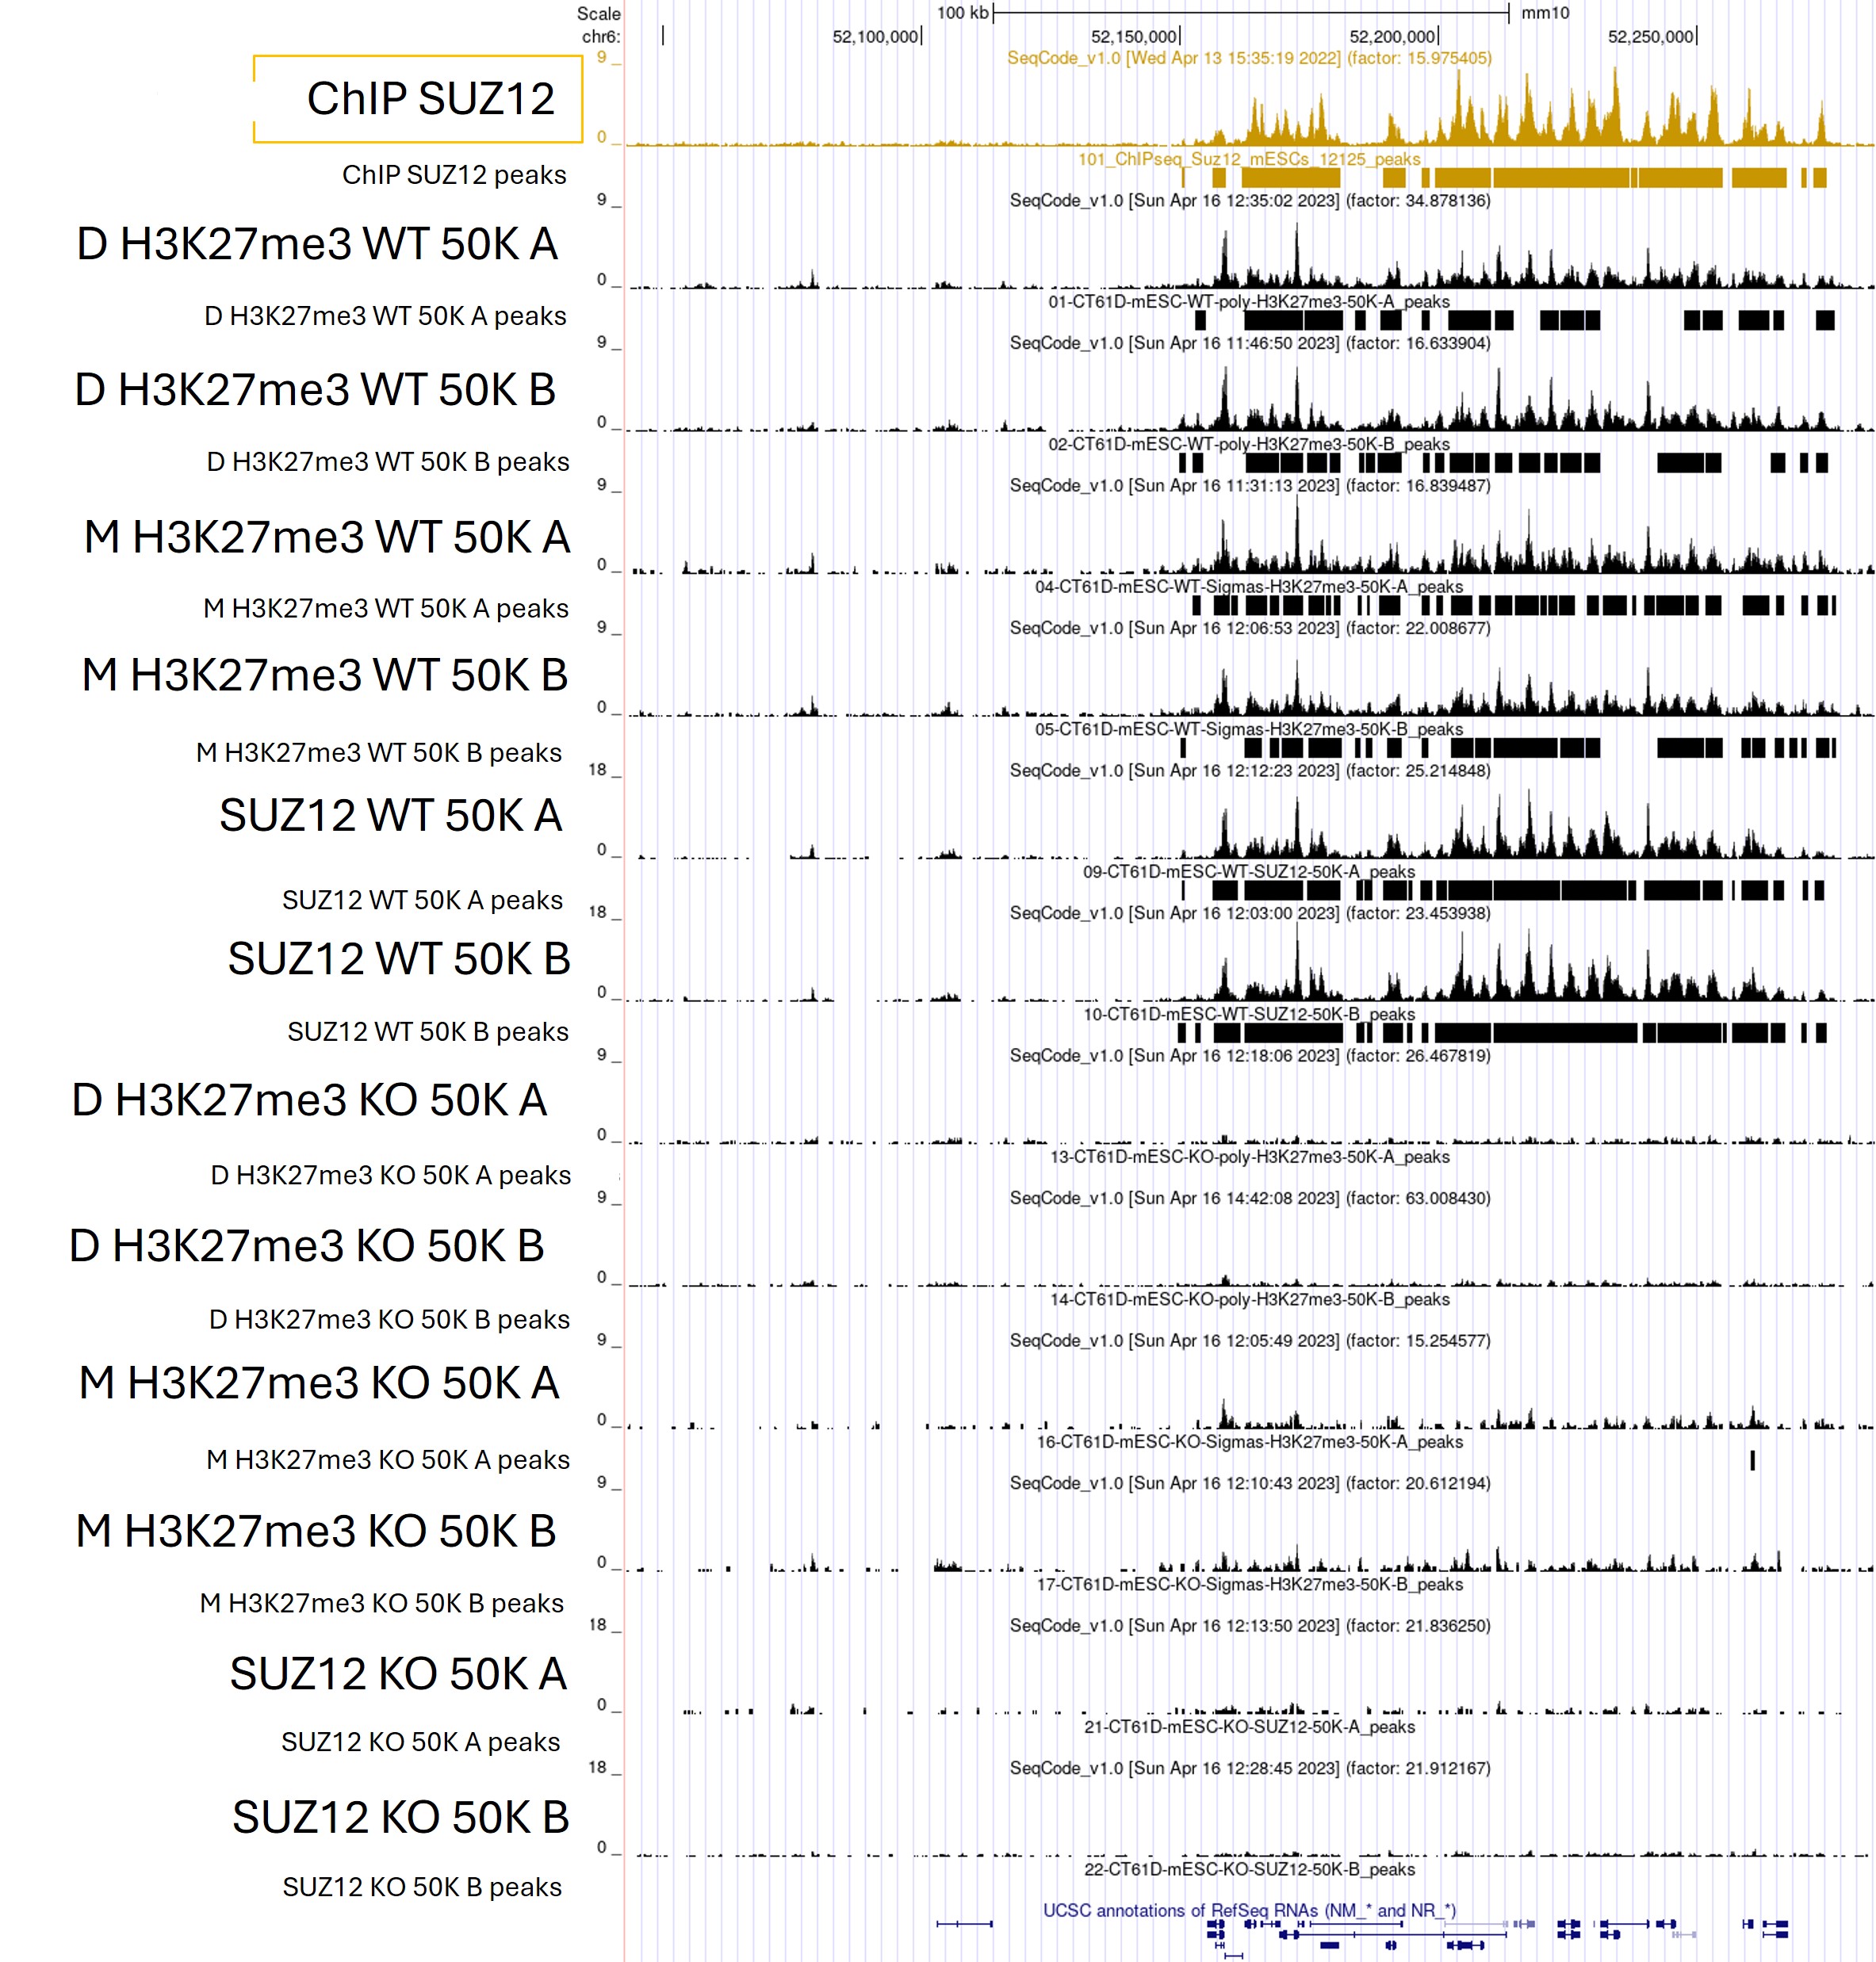
Figure 2. CUT&Tag profiles generated with the Universal CUT&Tag Kit from 50,000 wild‑type and SUZ12 knockout mESCs, kindly provided by Luciano Di Croce’s laboratory, show strong SUZ12 and H3K27me3 enrichment at the HOXA cluster in wild‑type cells and loss of both signals in the knockout—consistent with published evidence that SUZ12 deletion disrupts H3K27me3 deposition. This expected gain‑and‑loss pattern robustly confirms the assay’s target specificity. A published SUZ12 ChIP‑seq track from 1 million cells is shown as a reference, demonstrating that CUT&Tag produces comparable, high‑quality profiles from far fewer cells. Replicates A and B derive from one experiment, while D and M represent two independent experiments.
Robust Performance from Minimal Input
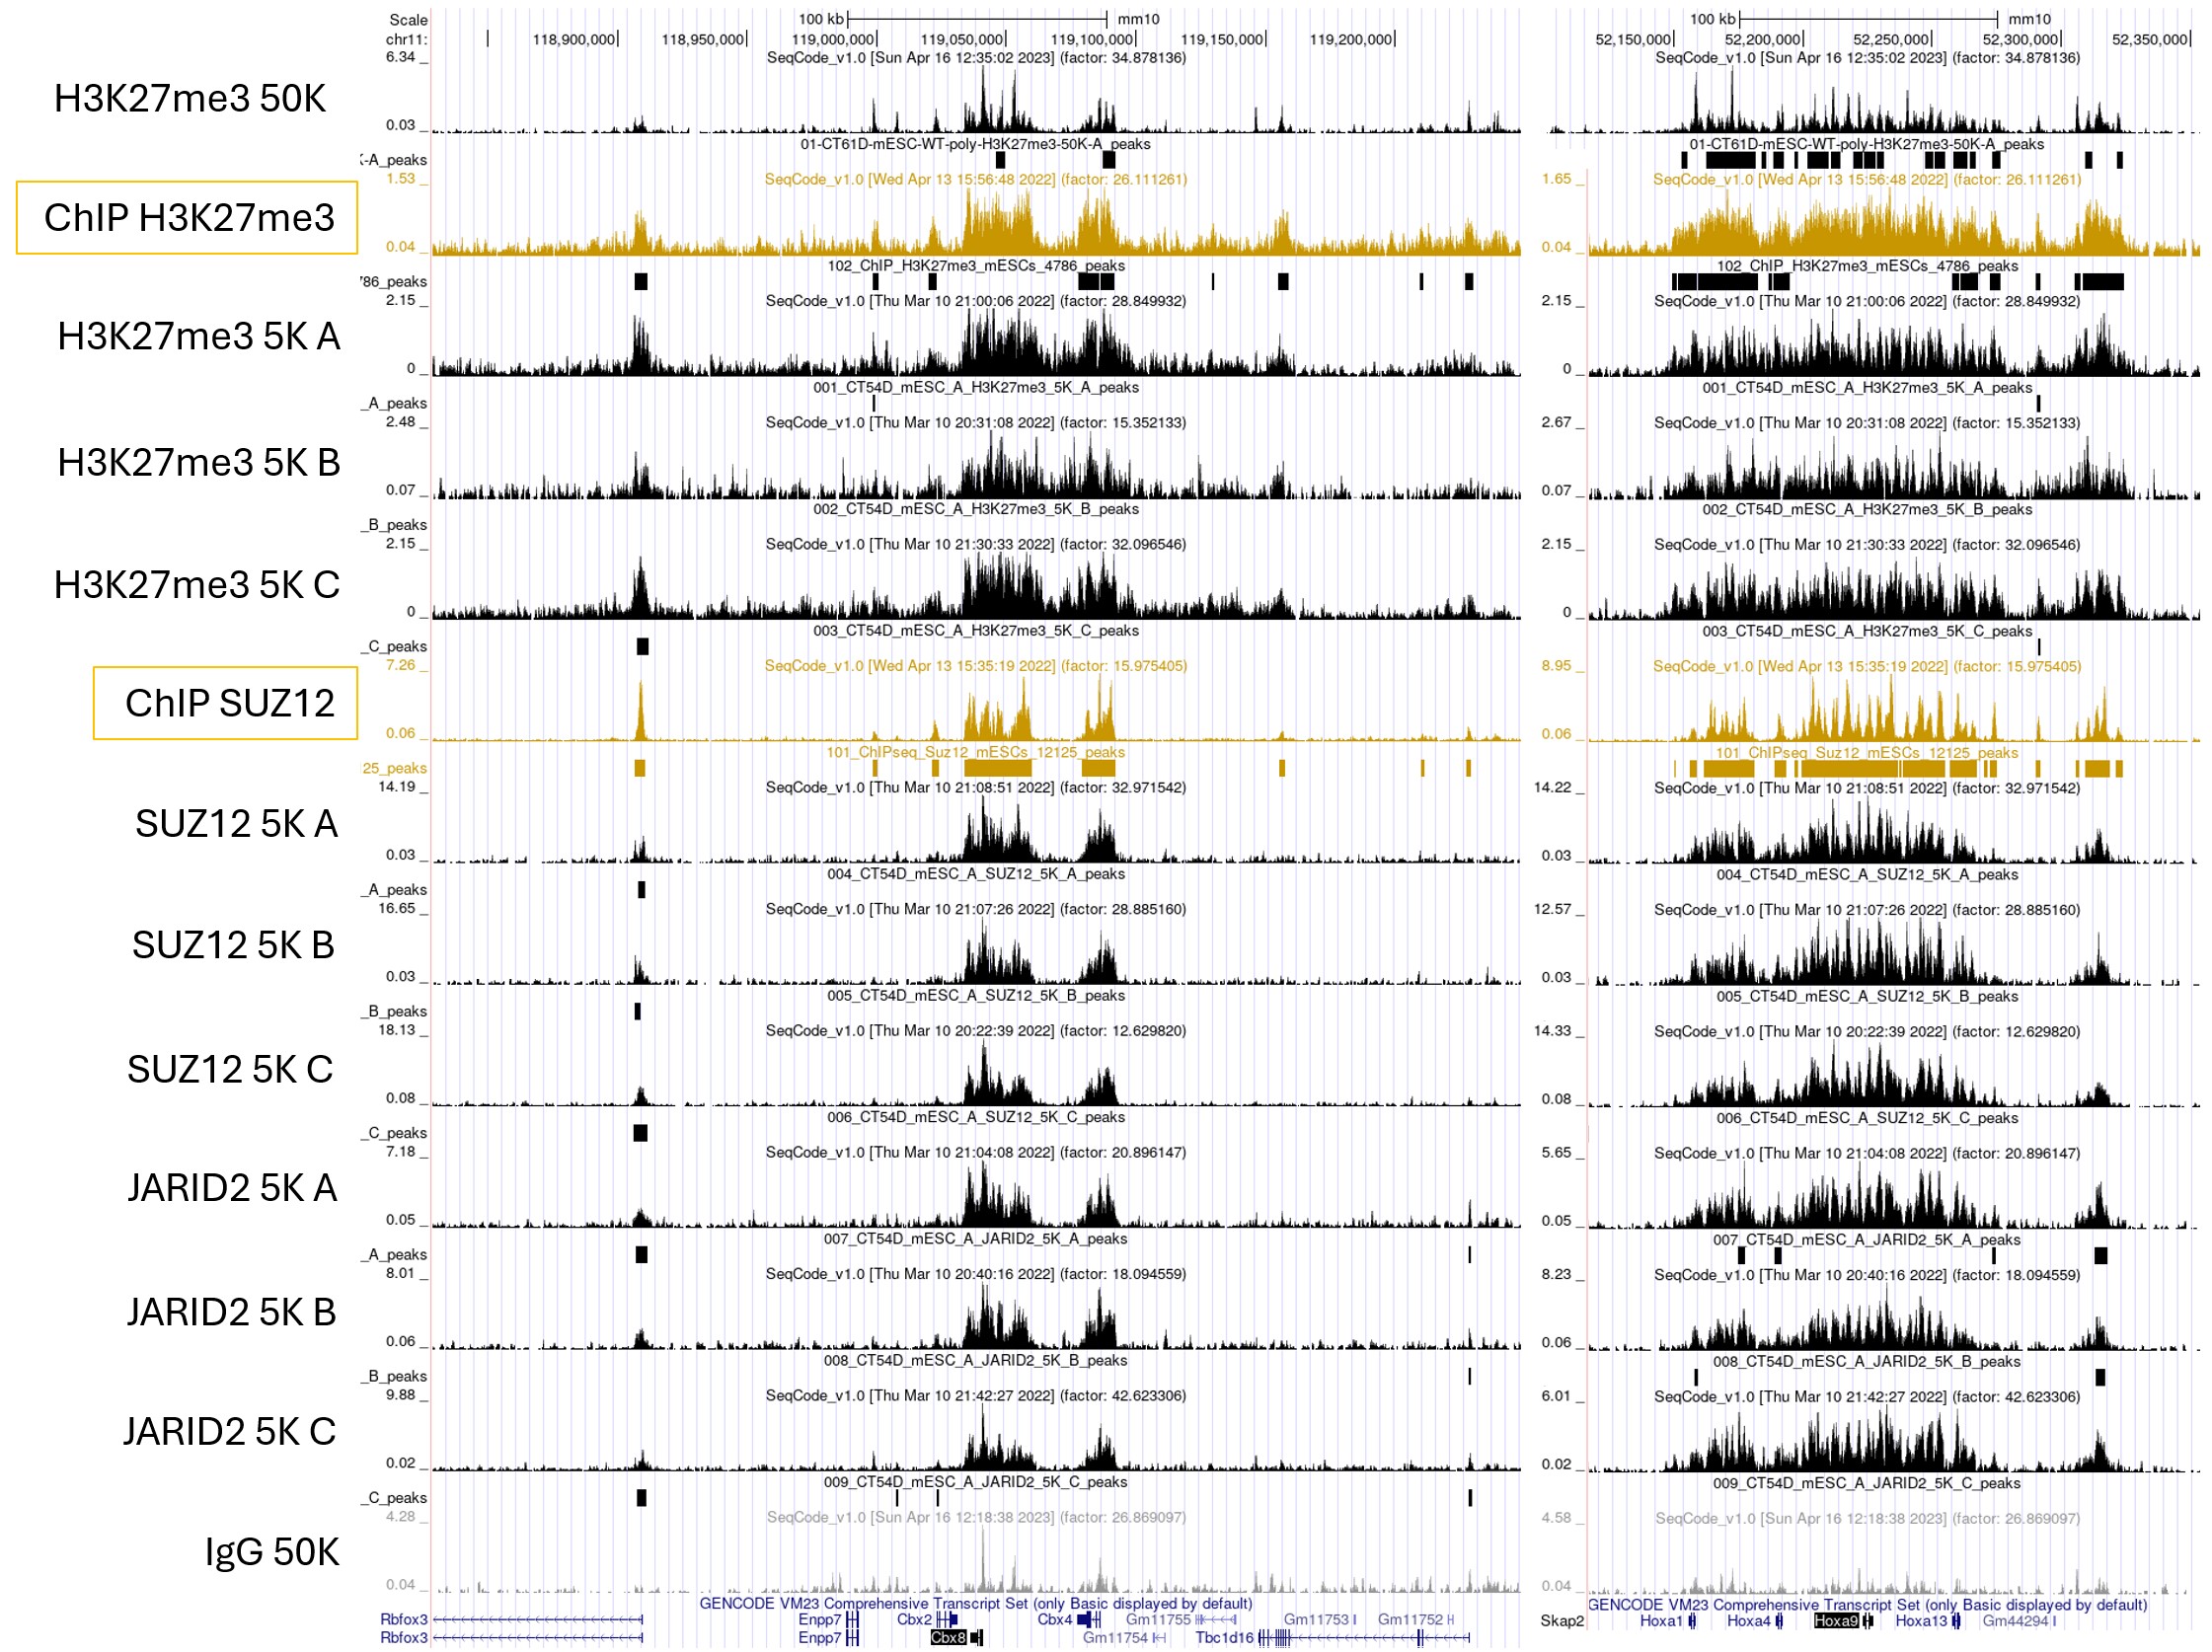
Figure 3. Universal CUT&Tag protocol enables high-quality chromatin profiling from as few as 5,000 mESCs cells, demonstrated across both histone marks (H3K27me3) and chromatin-associated proteins such as SUZ12 and JARID2. Clear enrichment is observed at key loci—including the HoxA cluster and Cbx2/4/8—with signal comparable to the published ChIP-seq reference. IgG serves as the negative control, and samples A, B, and C represent experimental replicates.
Data Quality Enhancement via IgG Normalization
A.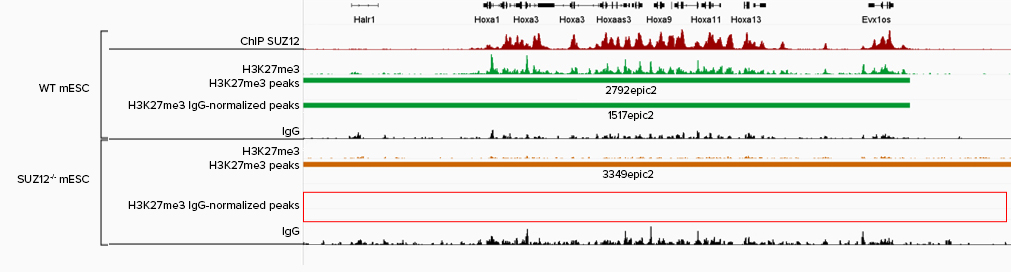 B.
B.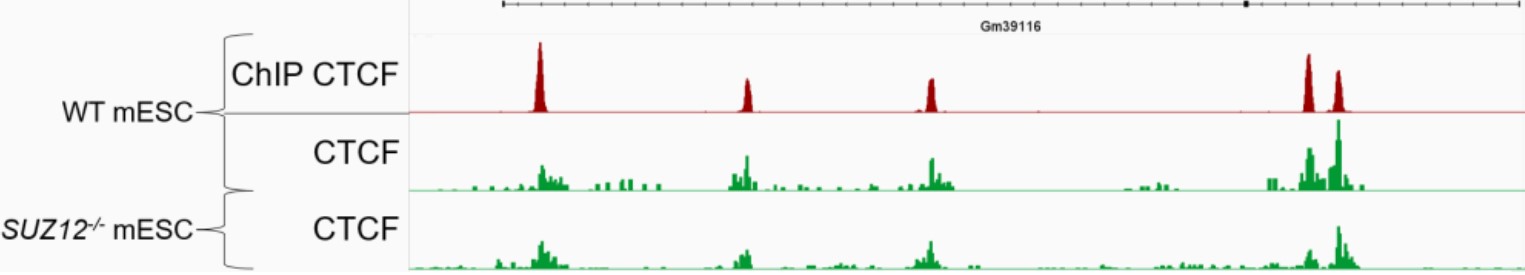
Figure 4. Refined Peak Calling with IgG Normalization. IgG normalization improves peak‑calling accuracy in CUT&Tag data. IGV tracks show H3K27me3 profiles (panel A) in wild‑type (green) and SUZ12 knockout (yellow‑brown) mESCs at the HOXA cluster, with peak‑caller outputs displayed below each track. The SUZ12 knockout mESCs, kindly provided by Luciano Di Croce’s laboratory, lack H3K27me3 deposition, consistent with published evidence that SUZ12 loss disrupts PRC2‑mediated H3K27me3. Before IgG normalization, residual background signal in knockout cells is incorrectly called as peaks, whereas normalization removes these false positives while preserving true H3K27me3 enrichment in wild‑type cells. CTCF profiles (panel B) are shown as a control unaffected by SUZ12 loss, demonstrating that normalization preserves genuine peaks for targets independent of PRC2 function. Overall, IgG normalization enhances CUT&Tag specificity by eliminating false positives while maintaining robust, biologically meaningful signals.
Protein A-Tn5 Is Compatible with Monoclonal Antibodies: High-Quality Profiling Demonstrated
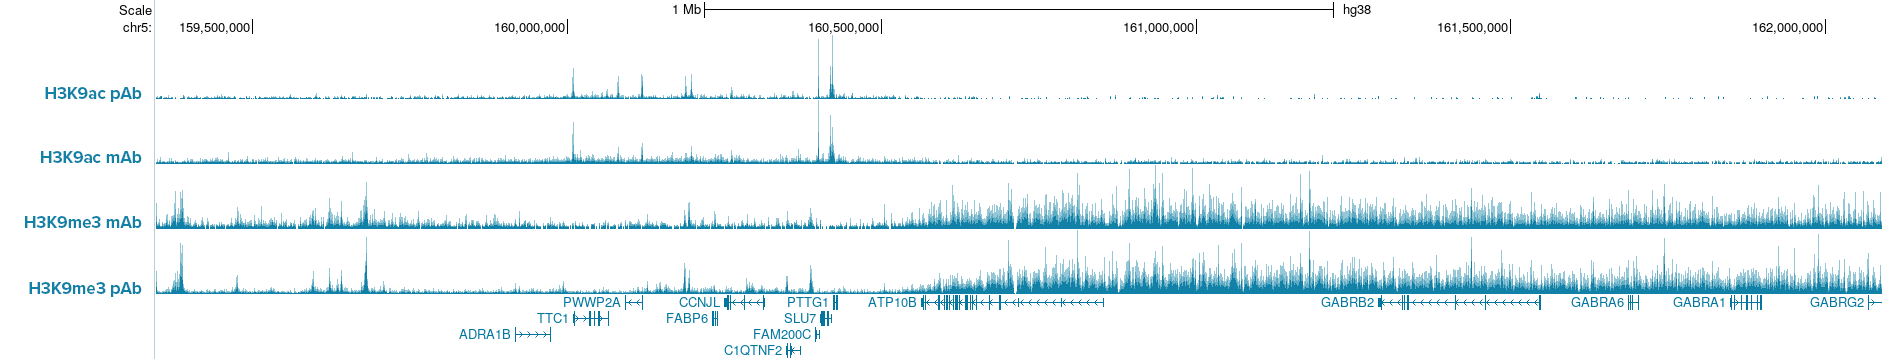
Figure 5. IGV browser tracks show CUT&Tag profiles of H3K9ac and H3K9me3 histone marks in K562 cells (50,000 cells per assay) using either monoclonal (mAb) or polyclonal (pAb) antibodies for each target. Comparable signal and peak enrichment demonstrate that Hologic Diagenode pA-Tn5 enables robust profiling with both monoclonal and polyclonal antibodies, indicating that pAG-Tn5 is not required. Antibodies used: H3K9ac pAb, Cat. no. C15410004; H3K9ac mAb, Cat. no. C152100185; H3K9me3 mAb, Cat. no. C15200146; H3K9me3 pAb, Cat. no. C15410056.
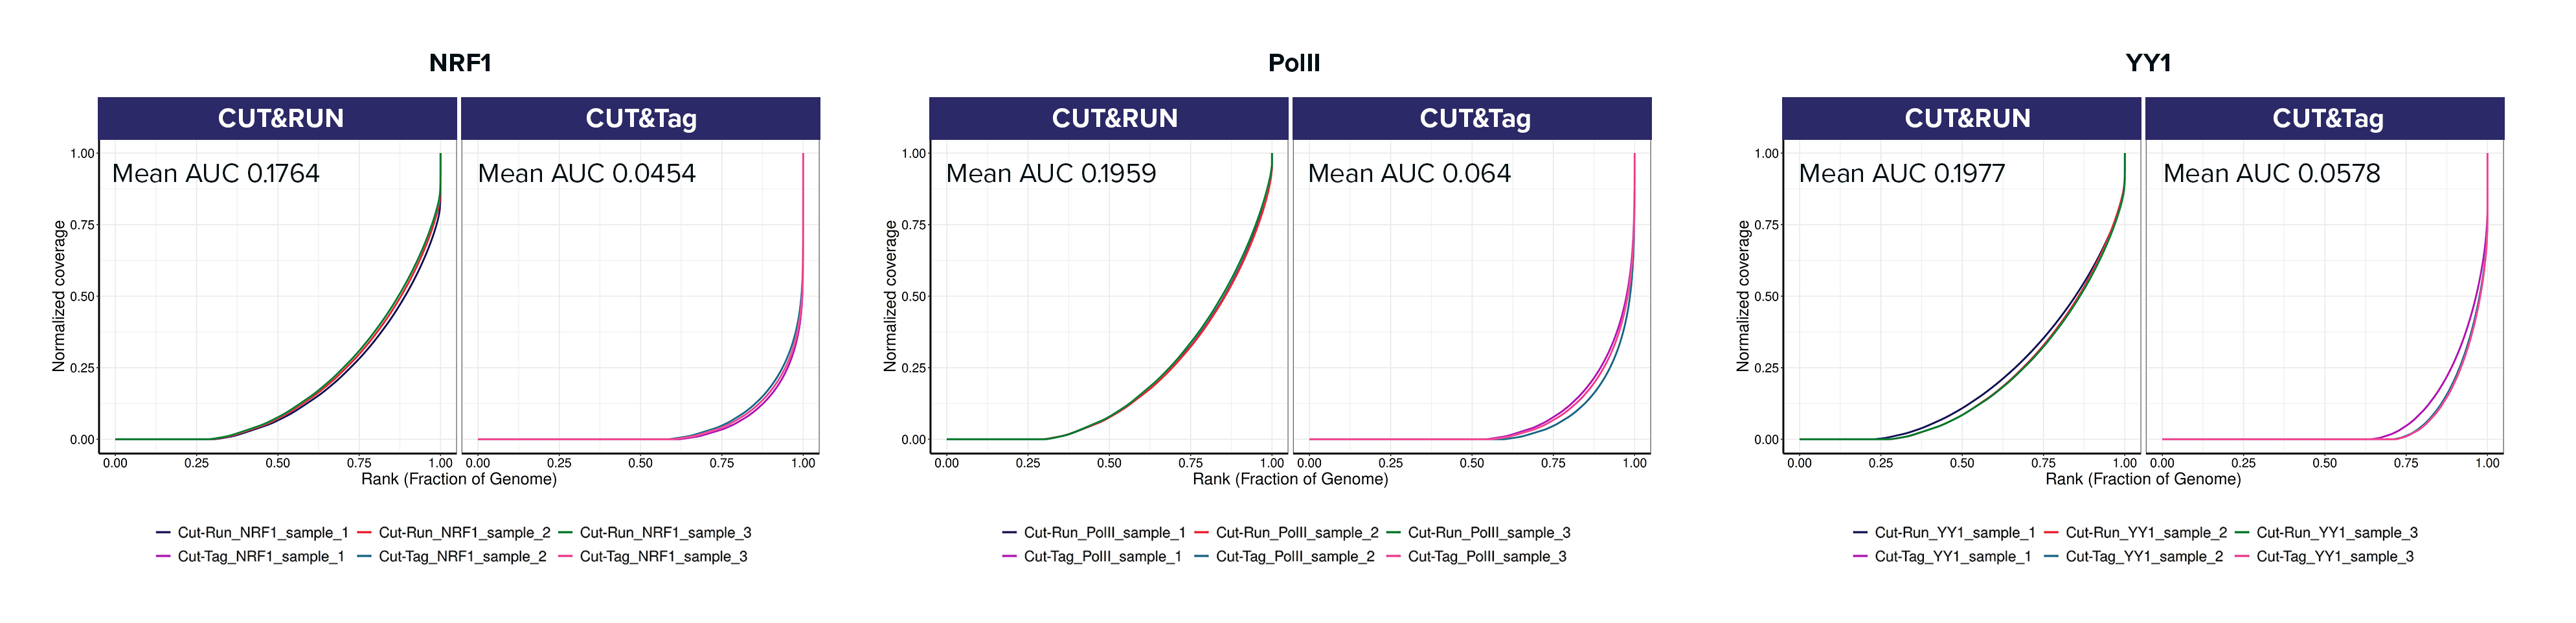
Highly Specific NRF1 CUT&Tag Recapitulates ENCODE Profiles and Expected K562 Programs
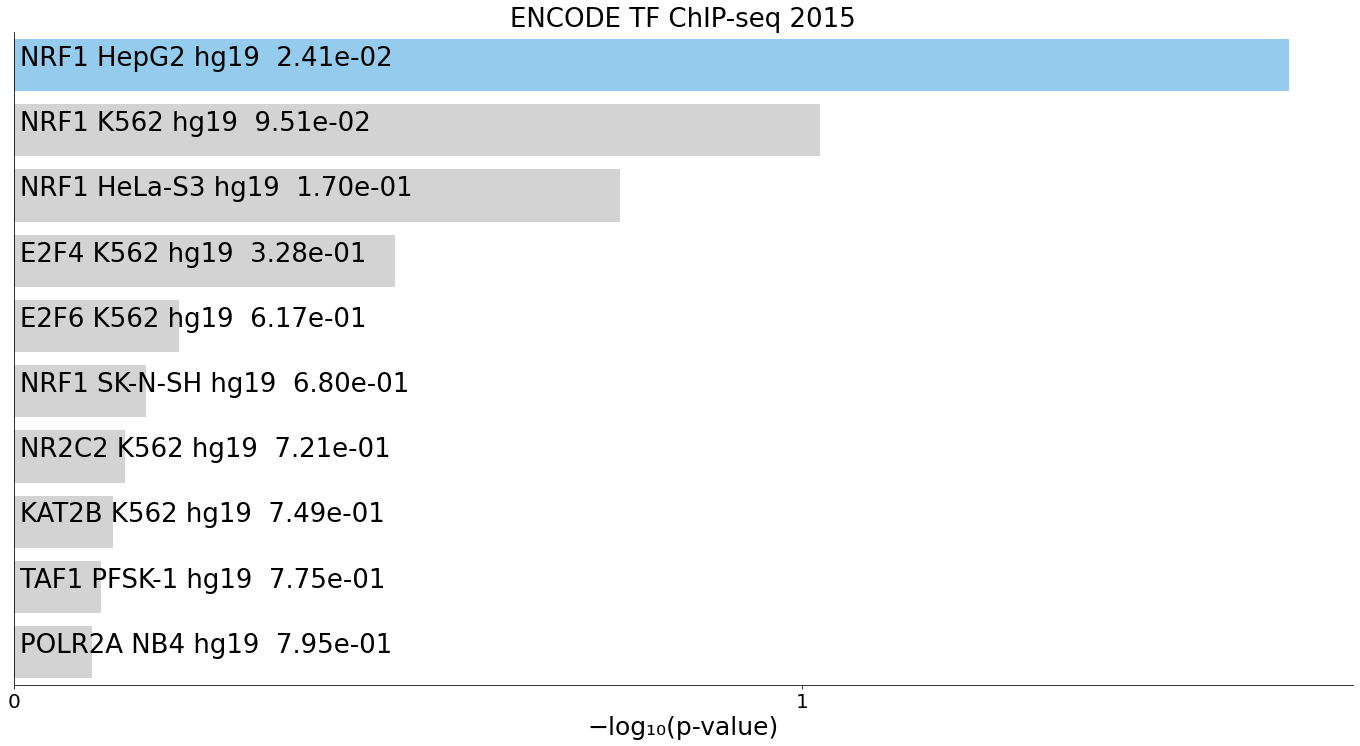
Figure 6. CUT&Tag profiling of NRF1 in K562 cells demonstrates high specificity through strong concordance with ENCODE NRF1 ChIP‑seq datasets and recapitulates expected metabolic and erythroid‑lineage programs.
CUT&Tag profiling was performed using the Universal CUT&Tag kit on 300,000 K562 cells with an NRF1 antibody. Peak‑associated genes were derived from the resulting NRF1 peak set, and functional similarity was assessed by screening against public gene‑set libraries using EnrichR.
(A) ENCODE_TF_ChIP‑seq_2015 enrichment.
NRF1 CUT&Tag peaks show near‑perfect concordance with ENCODE NRF1 ChIP‑seq signatures, providing strong orthogonal validation of assay specificity, data quality, and accurate identification of NRF1 binding sites.
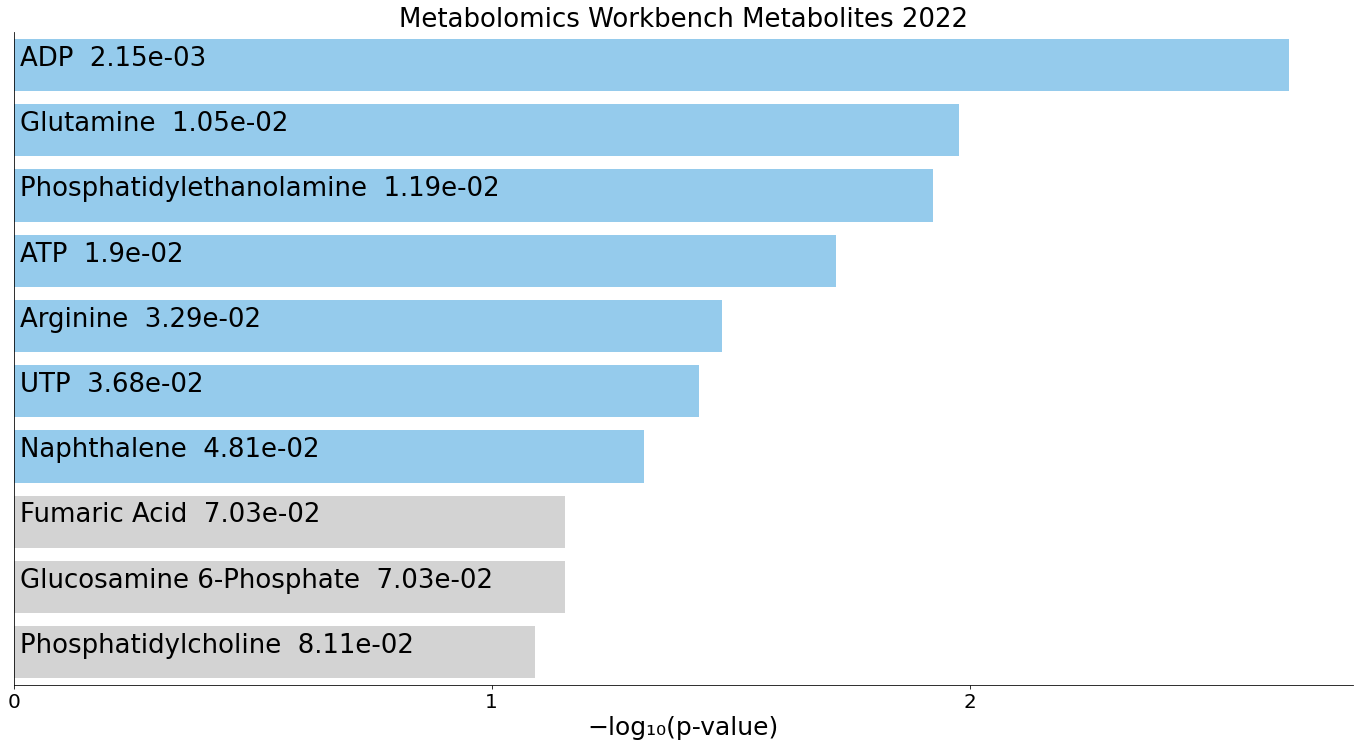
(B) Metabolomics_Workbench_Metabolites_2022 enrichment.
NRF1‑bound regions are significantly enriched for pathways involving ATP, ADP, glutamine, and phosphatidylethanolamine, reflecting NRF1’s well‑established involvement in mitochondrial regulation and metabolic gene network control.
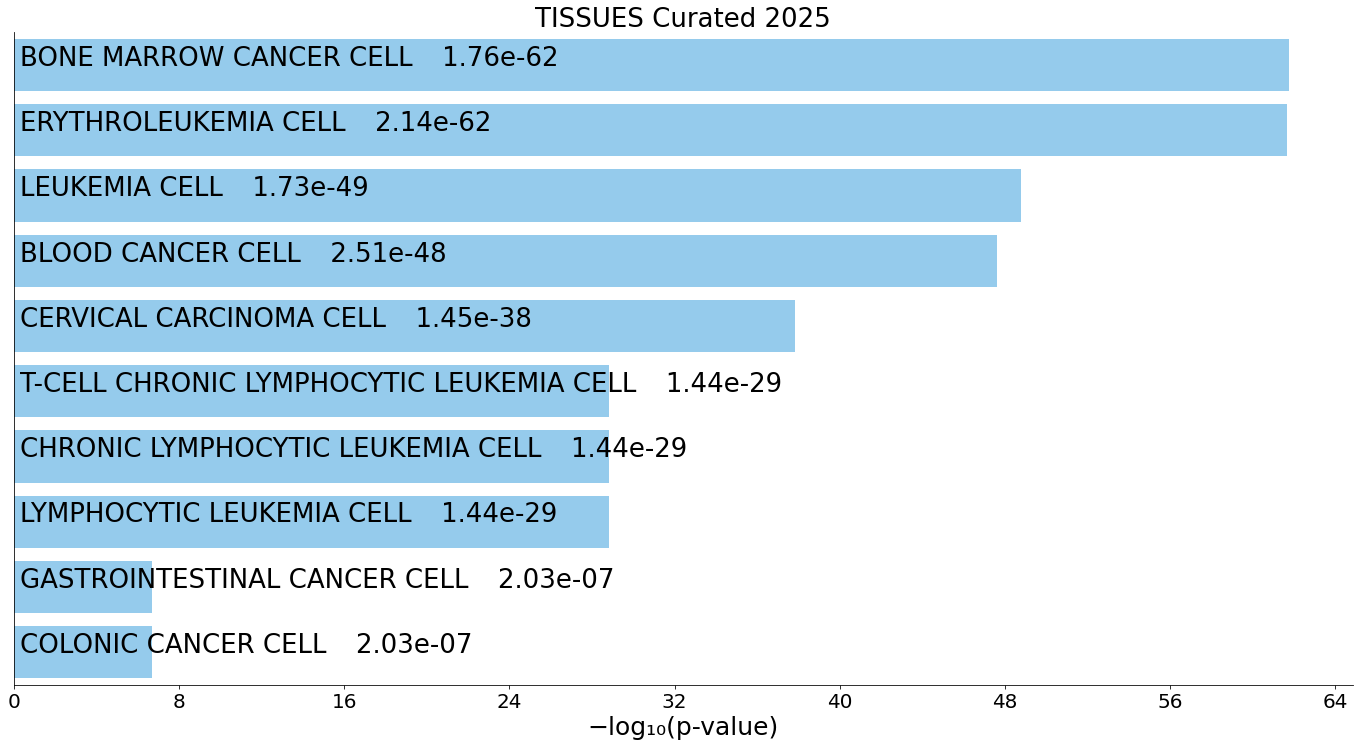
(C) TISSUES_Curated_2025 enrichment.
Tissue‑signature enrichment highlights strong erythroid‑lineage and bone‑marrow–derived programs, fully consistent with the erythroleukemia origin of K562 cells and confirming cell‑identity fidelity in the generated CUT&Tag dataset.
For all panels, the top 10 enriched terms are displayed as bar charts ranked by –log10(p‑value), with the corresponding p‑value shown alongside each term.