
| RIP RIP Read more |
Inosine Antibody
Catalog Number
Format
Price
Other format

Monoclonal antibody raised in mouse using Inosine (I) conjugated to BSA as immunogen.
| Lot | 002 |
|---|---|
| Concentration | 2 µg/µl |
| Species reactivity | Human, other (wide range): positive. |
| Type | Monoclonal |
| Purity | Protein A purified monoclonal antibody. |
| Host | Mouse |
| Storage Conditions | Store at -20°C; for long storage, store at -80°C. Avoid multiple freeze-thaw cycles. |
| Storage Buffer | PBS containing 0.05% sodium azide. |
| Precautions | This product is for research use only. Not for use in diagnostic or therapeutic procedures. |
| Applications | Suggested dilution | References |
|---|---|---|
| RIP * | 1 µg per IP | Fig 1 |
*Please note that the optimal antibody amount per IP should be determined by the end-user. We recommend testing 1 - 10 µg per IP.
- Validation DataA.
 B.
B.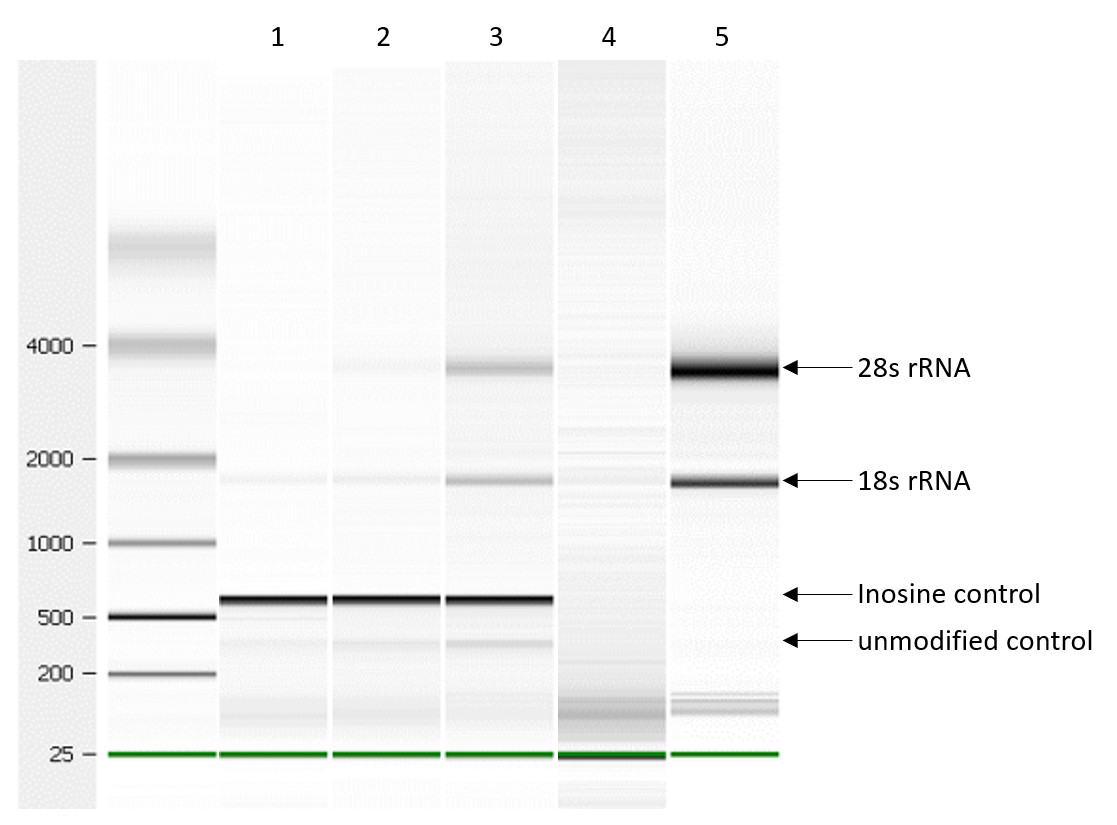
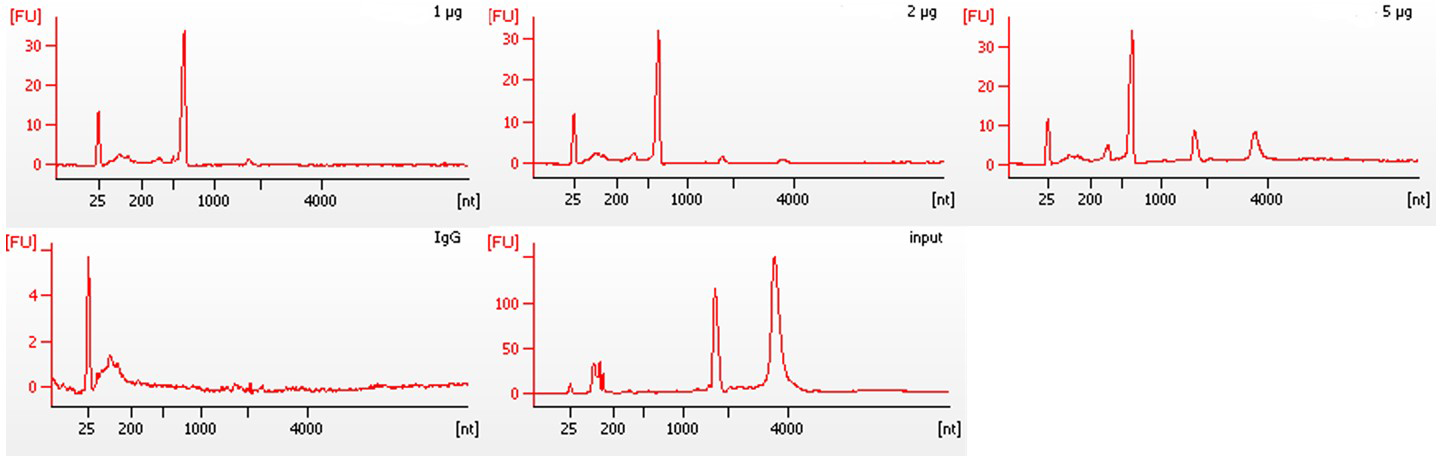
Figure 1. RNA immunoprecipitation using the Diagenode monoclonal antibody directed against Inosine
IP was performed with the Diagenode antibody against Inosine (cat. No. C15200251) on 40 µg total RNA from human HeLa cells, spiked with an in vitro produced RNA molecule containing Inosine nucleotides as well as an unmodified control RNA (40 ng each). A titration of the antibody of 1, 2 and 5 µg was analyzed. IgG (2 µg/IP) was used as negative control.
Figure 1A The immunoprecipitated RNA was subsequently analysed on a Bioanalyzer. The peak at ~500 bp corresponds to the Inosine spike in, whereas the negative control spike in (expected size ~300 bp) is not captured by the antibody.
Figure 1B shows the gel image for the Inosine antibody (lane 1, 2 and 3), the IgG negative control (lane 4) and the input (lane 5). The marker (in bp) is shown on the left, the position of the 28s and 18s ribosomal RNA and of both spike in controls is indicated on the right. - Publications

How to properly cite our product/service in your work
We strongly recommend using this: Inosine Antibody (Hologic Diagenode Cat# C15200251 Lot# 002). Click here to copy to clipboard.
Using our products or services in your publication? Let us know!