p300 (UniProt/Swiss-Prot entry Q09472) is a histone acetyltransferase that regulates transcription via chromatin remodelling. As such it is important for cell proliferation and differentiation. p300 is able to acetylate all four core histones in nucleosomes. Acetylation of histones is associated with transcriptional activation. p300 also acetylates non-histone proteins such as HDAC1 leading to its inactivation and modulation of transcription. It has also been identified as a co-activator of HIF1A (hypoxiainducible factor 1 alpha), and thus plays a role in the stimulation of hypoxia-induced genes such as VEGF. Defects in the p300 gene are a cause of Rubinstein-Taybi syndrome and may also play a role in epithelial cancer.
p300 Antibody

Alternative names: EP300, KAT3B, RSTS2
Monoclonal antibody raised in mouse against human p300 (E1A Binding Protein P300) by DNA immunization in which the C-terminal part of the protein was cloned and expressed.
| Lot | 002 |
|---|---|
| Concentration | 1.8 µg/µl |
| Species reactivity | Human. Other species: not tested. |
| Type | Monoclonal |
| Purity | Protein A purified monoclonal antibody |
| Host | Mouse |
| Storage Conditions | Store at -20°C; for long storage, store at -80°C. Avoid multiple freeze-thaw cycles. |
| Storage Buffer | PBS containing 0.05% azide. |
| Precautions | This product is for research use only. Not for use in diagnostic or therapeutic procedures. |
| Applications | Suggested dilution | References |
|---|---|---|
| ChIP/ChIP-seq * | 2-5 μg/ChIP | Fig 1, 2 |
| Western Blotting | Not Recommended |
* Please note that the optimal antibody amount per IP should be determined by the end-user. We recommend testing 1-10 μg per IP.
- Validation Data
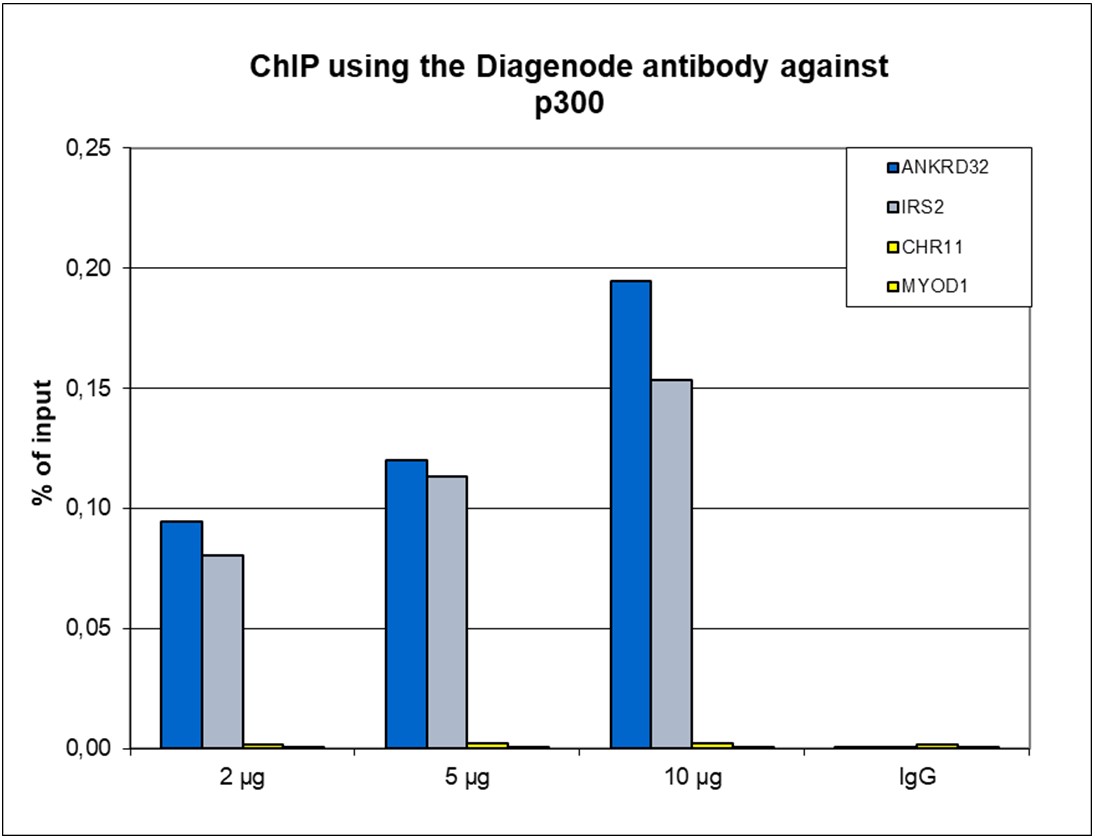
Figure 1. ChIP results obtained with the Diagenode monoclonal antibody directed against p300
ChIP was performed using HeLa cells, the Diagenode monoclonal antibody against p300 (cat. No. C15200211) and optimized PCR primer sets for qPCR. ChIP was performed with the “iDeal ChIP-seq” kit (cat. No. C01010055), using sheared chromatin from 4 million cells. A titration of the antibody consisting of 2, 5 and 10 µg per ChIP experiment was analysed. IgG (2 µg/IP) was used as negative IP control. Quantitative PCR was performed with primers for two genomic regions near the ANKRD32 and IRS2 genes, used as positive controls, and for the coding region of the inactive MYOD1 gene and an intergeic region on chromosome 11, used as negative controls. Figure 1 shows the recovery, expressed as a % of input (the relative amount of immunoprecipitated DNA compared to input DNA after qPCR analysis).
A.
B.
C.
D.
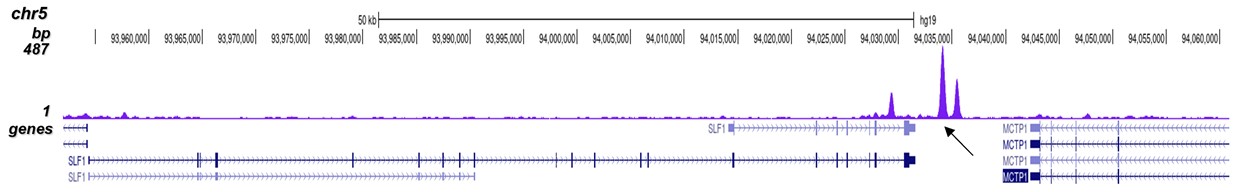
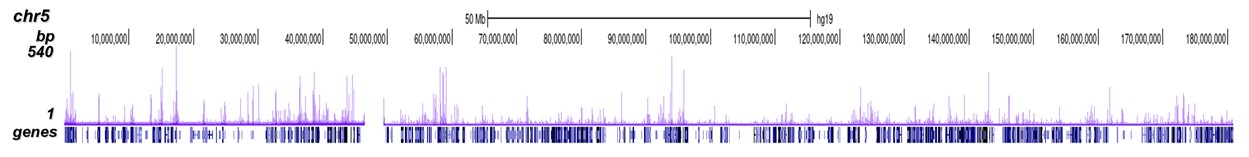
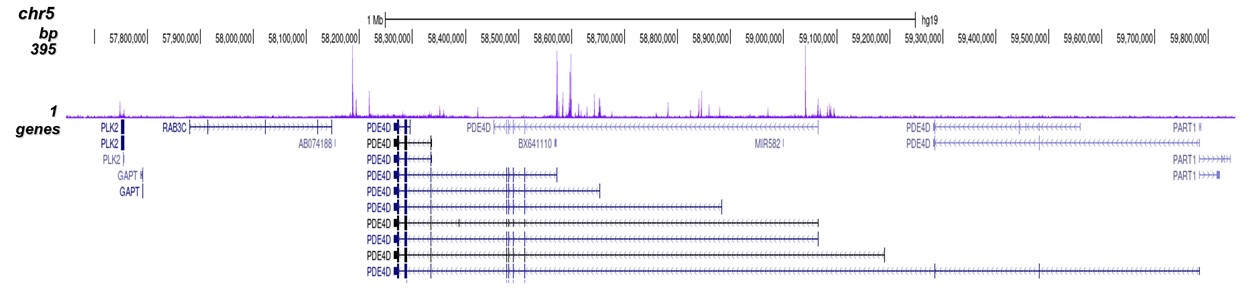
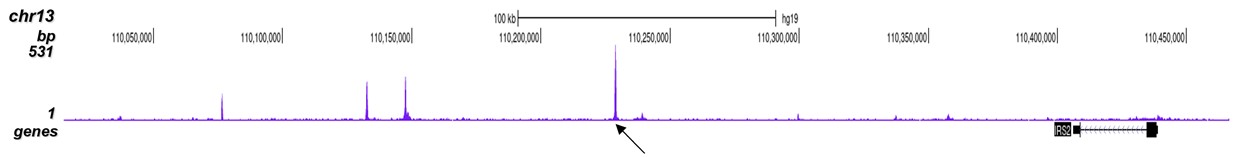
Figure 2. ChIP-seq results obtained with the Diagenode monoclonal antibody directed against p300
ChIP was performed with 5 µg of the Diagenode antibody against p300 (cat. No. C15200211) on sheared chromatin from 4 million HeLa cells as described above. The IP'd DNA was subsequently analysed on an Illumina NovaSeq. Library preparation, cluster generation and sequencing were performed according to the manufacturer's instructions. The 50 bp tags were aligned to the human genome using the BWA algorithm. Figure 2 shows the peak distribution along the complete sequence and a 3 mb region of chromosome 5 (figure 2A and B) and in two regions surrounding the IRS2 and ANKRD32 (SLF1) positive control genes (figure 2C and D). The position of the amplicon used for ChIP-qPCR is indicated by an arrow.
- Publications

How to properly cite our product/service in your work
We strongly recommend using this: p300 Antibody (Hologic Diagenode Cat# C15200211 Lot# 002). Click here to copy to clipboard.
Using our products or services in your publication? Let us know!
MECOM is a master repressor of myeloid differentiation through dose control of CEBPA in acute myeloid leukemia
Dorien Pastoors et al.
Enhancer translocations, due to 3q26 rearrangements, drive out-of-context MECOM expression in an aggressive subtype of acute myeloid leukemia (AML). Direct depletion of MECOM using an endogenous auxin-inducible degron immediately upregulates expression of myeloid differentiation factor CEBPA. MECOM depletion is also...KDM6B drives epigenetic reprogramming associated with lymphoid stromal cell early commitment and immune properties
Sylvestre M. et al.
Mature lymphoid stromal cells (LSCs) are key organizers of immune responses within secondary lymphoid organs. Similarly, inflammation-driven tertiary lymphoid structures depend on immunofibroblasts producing lymphoid cytokines and chemokines. Recent studies have explored the origin and heterogeneity of LSC/immunofib...SALL1 enforces microglia-specific DNA binding and function of SMADsto establish microglia identity.
Fixsen B. R. et al.
Spalt-like transcription factor 1 (SALL1) is a critical regulator of organogenesis and microglia identity. Here we demonstrate that disruption of a conserved microglia-specific super-enhancer interacting with the Sall1 promoter results in complete and specific loss of Sall1 expression in microglia. By determining th...Androgen and glucocorticoid receptor direct distinct transcriptionalprograms by receptor-specific and shared DNA binding sites.
Kulik, Marina et al.
The glucocorticoid (GR) and androgen (AR) receptors execute unique functions in vivo, yet have nearly identical DNA binding specificities. To identify mechanisms that facilitate functional diversification among these transcription factor paralogs, we studied them in an equivalent cellular context. Analysis of chroma...Niche-Specific Reprogramming of Epigenetic Landscapes Drives Myeloid Cell Diversity in Nonalcoholic Steatohepatitis.
Seidman JS, Troutman TD, Sakai M, Gola A, Spann NJ, Bennett H, Bruni CM, Ouyang Z, Li RZ, Sun X, Vu BT, Pasillas MP, Ego KM, Gosselin D, Link VM, Chong LW, Evans RM, Thompson BM, McDonald JG, Hosseini M, Witztum JL, Germain RN, Glass CK
Tissue-resident and recruited macrophages contribute to both host defense and pathology. Multiple macrophage phenotypes are represented in diseased tissues, but we lack deep understanding of mechanisms controlling diversification. Here, we investigate origins and epigenetic trajectories of hepatic macrophages during...The TGF-β profibrotic cascade targets ecto-5'-nucleotidase gene in proximal tubule epithelial cells and is a traceable marker of progressive diabetic kidney disease.
Cappelli C, Tellez A, Jara C, Alarcón S, Torres A, Mendoza P, Podestá L, Flores C, Quezada C, Oyarzún C, Martín RS
Progressive diabetic nephropathy (DN) and loss of renal function correlate with kidney fibrosis. Crosstalk between TGF-β and adenosinergic signaling contributes to the phenotypic transition of cells and to renal fibrosis in DN models. We evaluated the role of TGF-β on NT5E gene expression coding for the ec...